Raincloud Plot
 Raincloud Plot
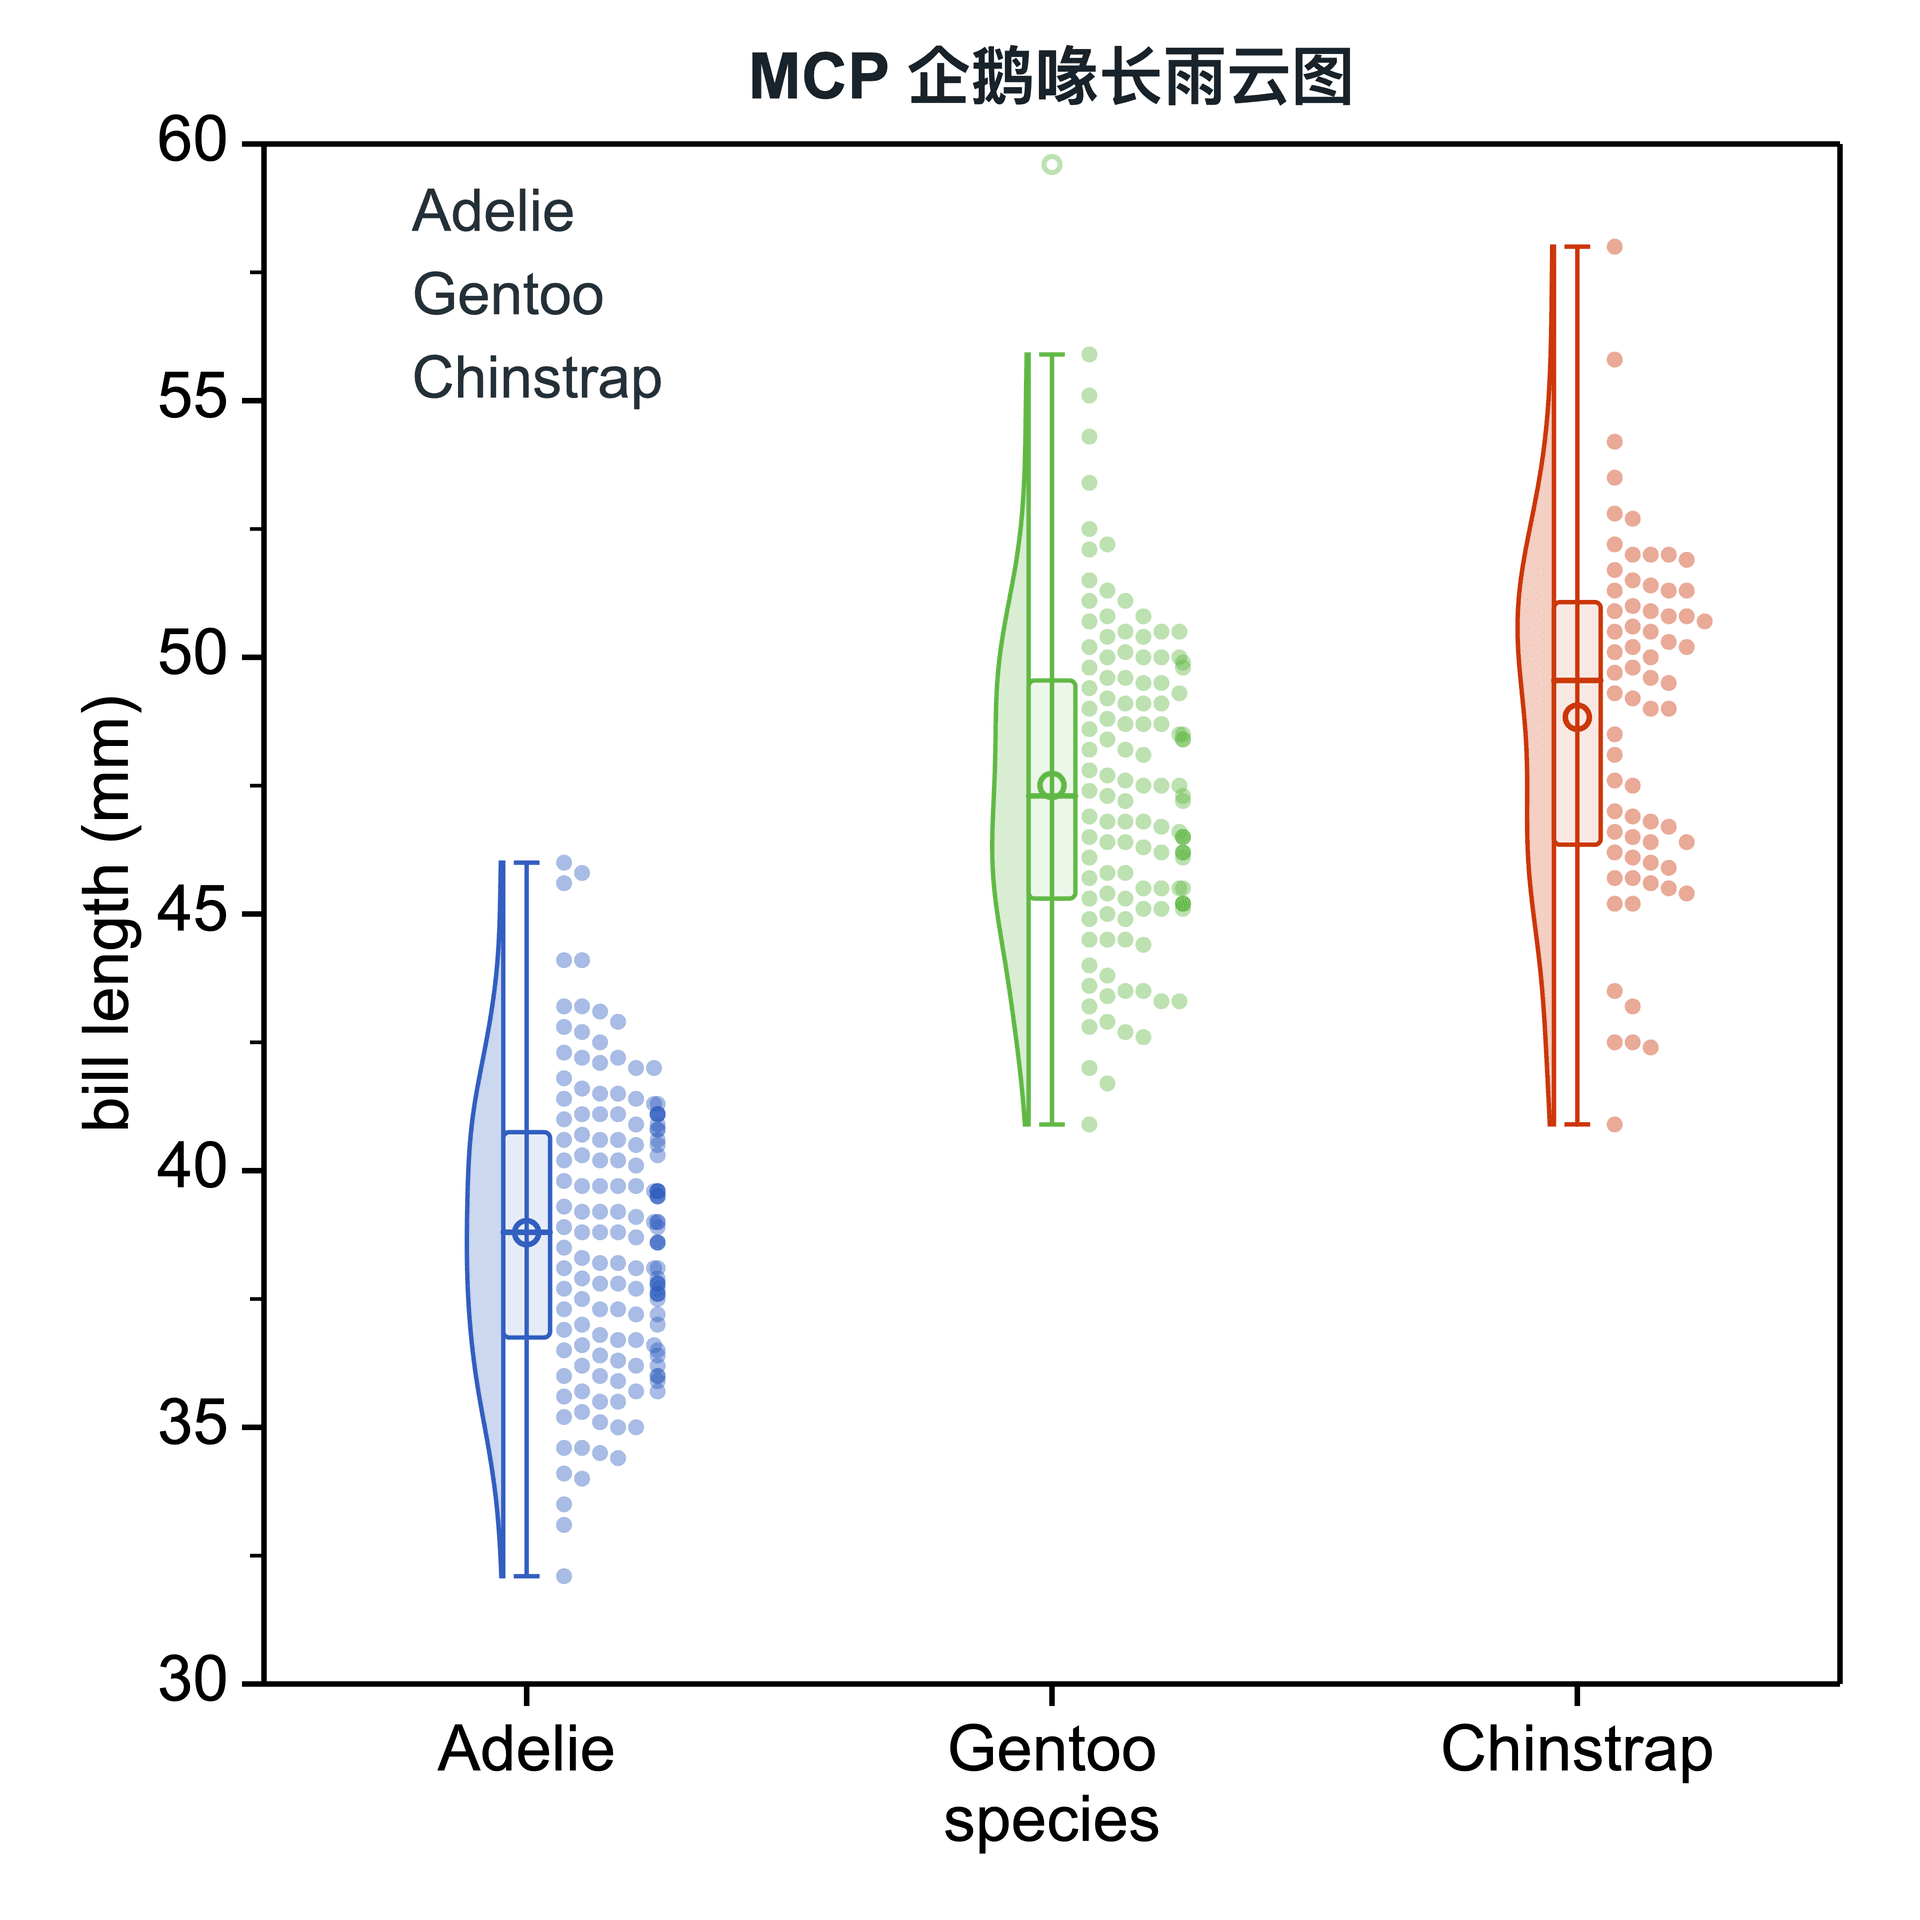
A raincloud plot combines distribution shape, a statistical summary, and the underlying observations on one axis.
Prepare a directly mappable table
Use continuous numeric measurements split into categories or experimental groups, especially when a box plot alone would hide distribution shape.
Prepare one group/category column and at least one numeric value column. Missing and non-numeric values should be checked before plotting.
Practice data · grouped long table| species | bill_length_mm |
|---|
| Adelie | 39.1 |
| Adelie | 40.3 |
| Adelie | 36.7 |
| Gentoo | 46.1 |
| Gentoo | 48.7 |
| Gentoo | 50.0 |
| Chinstrap | 48.7 |
| Chinstrap | 50.8 |
| Chinstrap | 52.0 |
Create a raincloud plot
Combine a one-sided density, box summary, and raw observations to show distribution shape and individual values together.
Step 1Open the workflow
Choose Plot → Raincloud Plot and use the full table or current selection.
Raincloud settingsInterface preview · non-interactive
×MenuPlot → Raincloud Plot
Data rangeFull table: 9 rows, 2 columns
OutputNew figure
Add to existing figure
Raincloud settingsInterface preview · non-interactive
×Value columnsbill_length_mm · Y⌄
Group columnspecies · Group⌄
Map the data
Map the group column and select one or more numeric value columns.
Step 3Arrange cloud and rain
Choose density side and smoothing, then select beeswarm or jitter for the raw observations.
Raincloud settingsInterface preview · non-interactive
×Show points
✓Show mean
✓Show median line
Show median value
✓Show outliers
Show density curve
Raincloud settingsInterface preview · non-interactive
×Show points
✓Show mean
✓Show median line
Data tablePenguin bill data
Mapped columns2
Keep comparisons fair
Create the figure and decide which layers—density, box, points, mean, median, and outliers—should remain visible.
Settings and pre-export checks
- Density side and width
- Density smoothing and truncation
- Density fill and opacity
- Beeswarm or jitter points
- Point side and gap
- Box, mean, median, and outliers
- Keep raw points visible when sample size and overlap allow it.
- Use the same smoothing rule when comparing groups.
- Beeswarm placement is deterministic; jitter intentionally introduces visual displacement.
- A density estimate can look stable even with limited data, so always consider sample size.