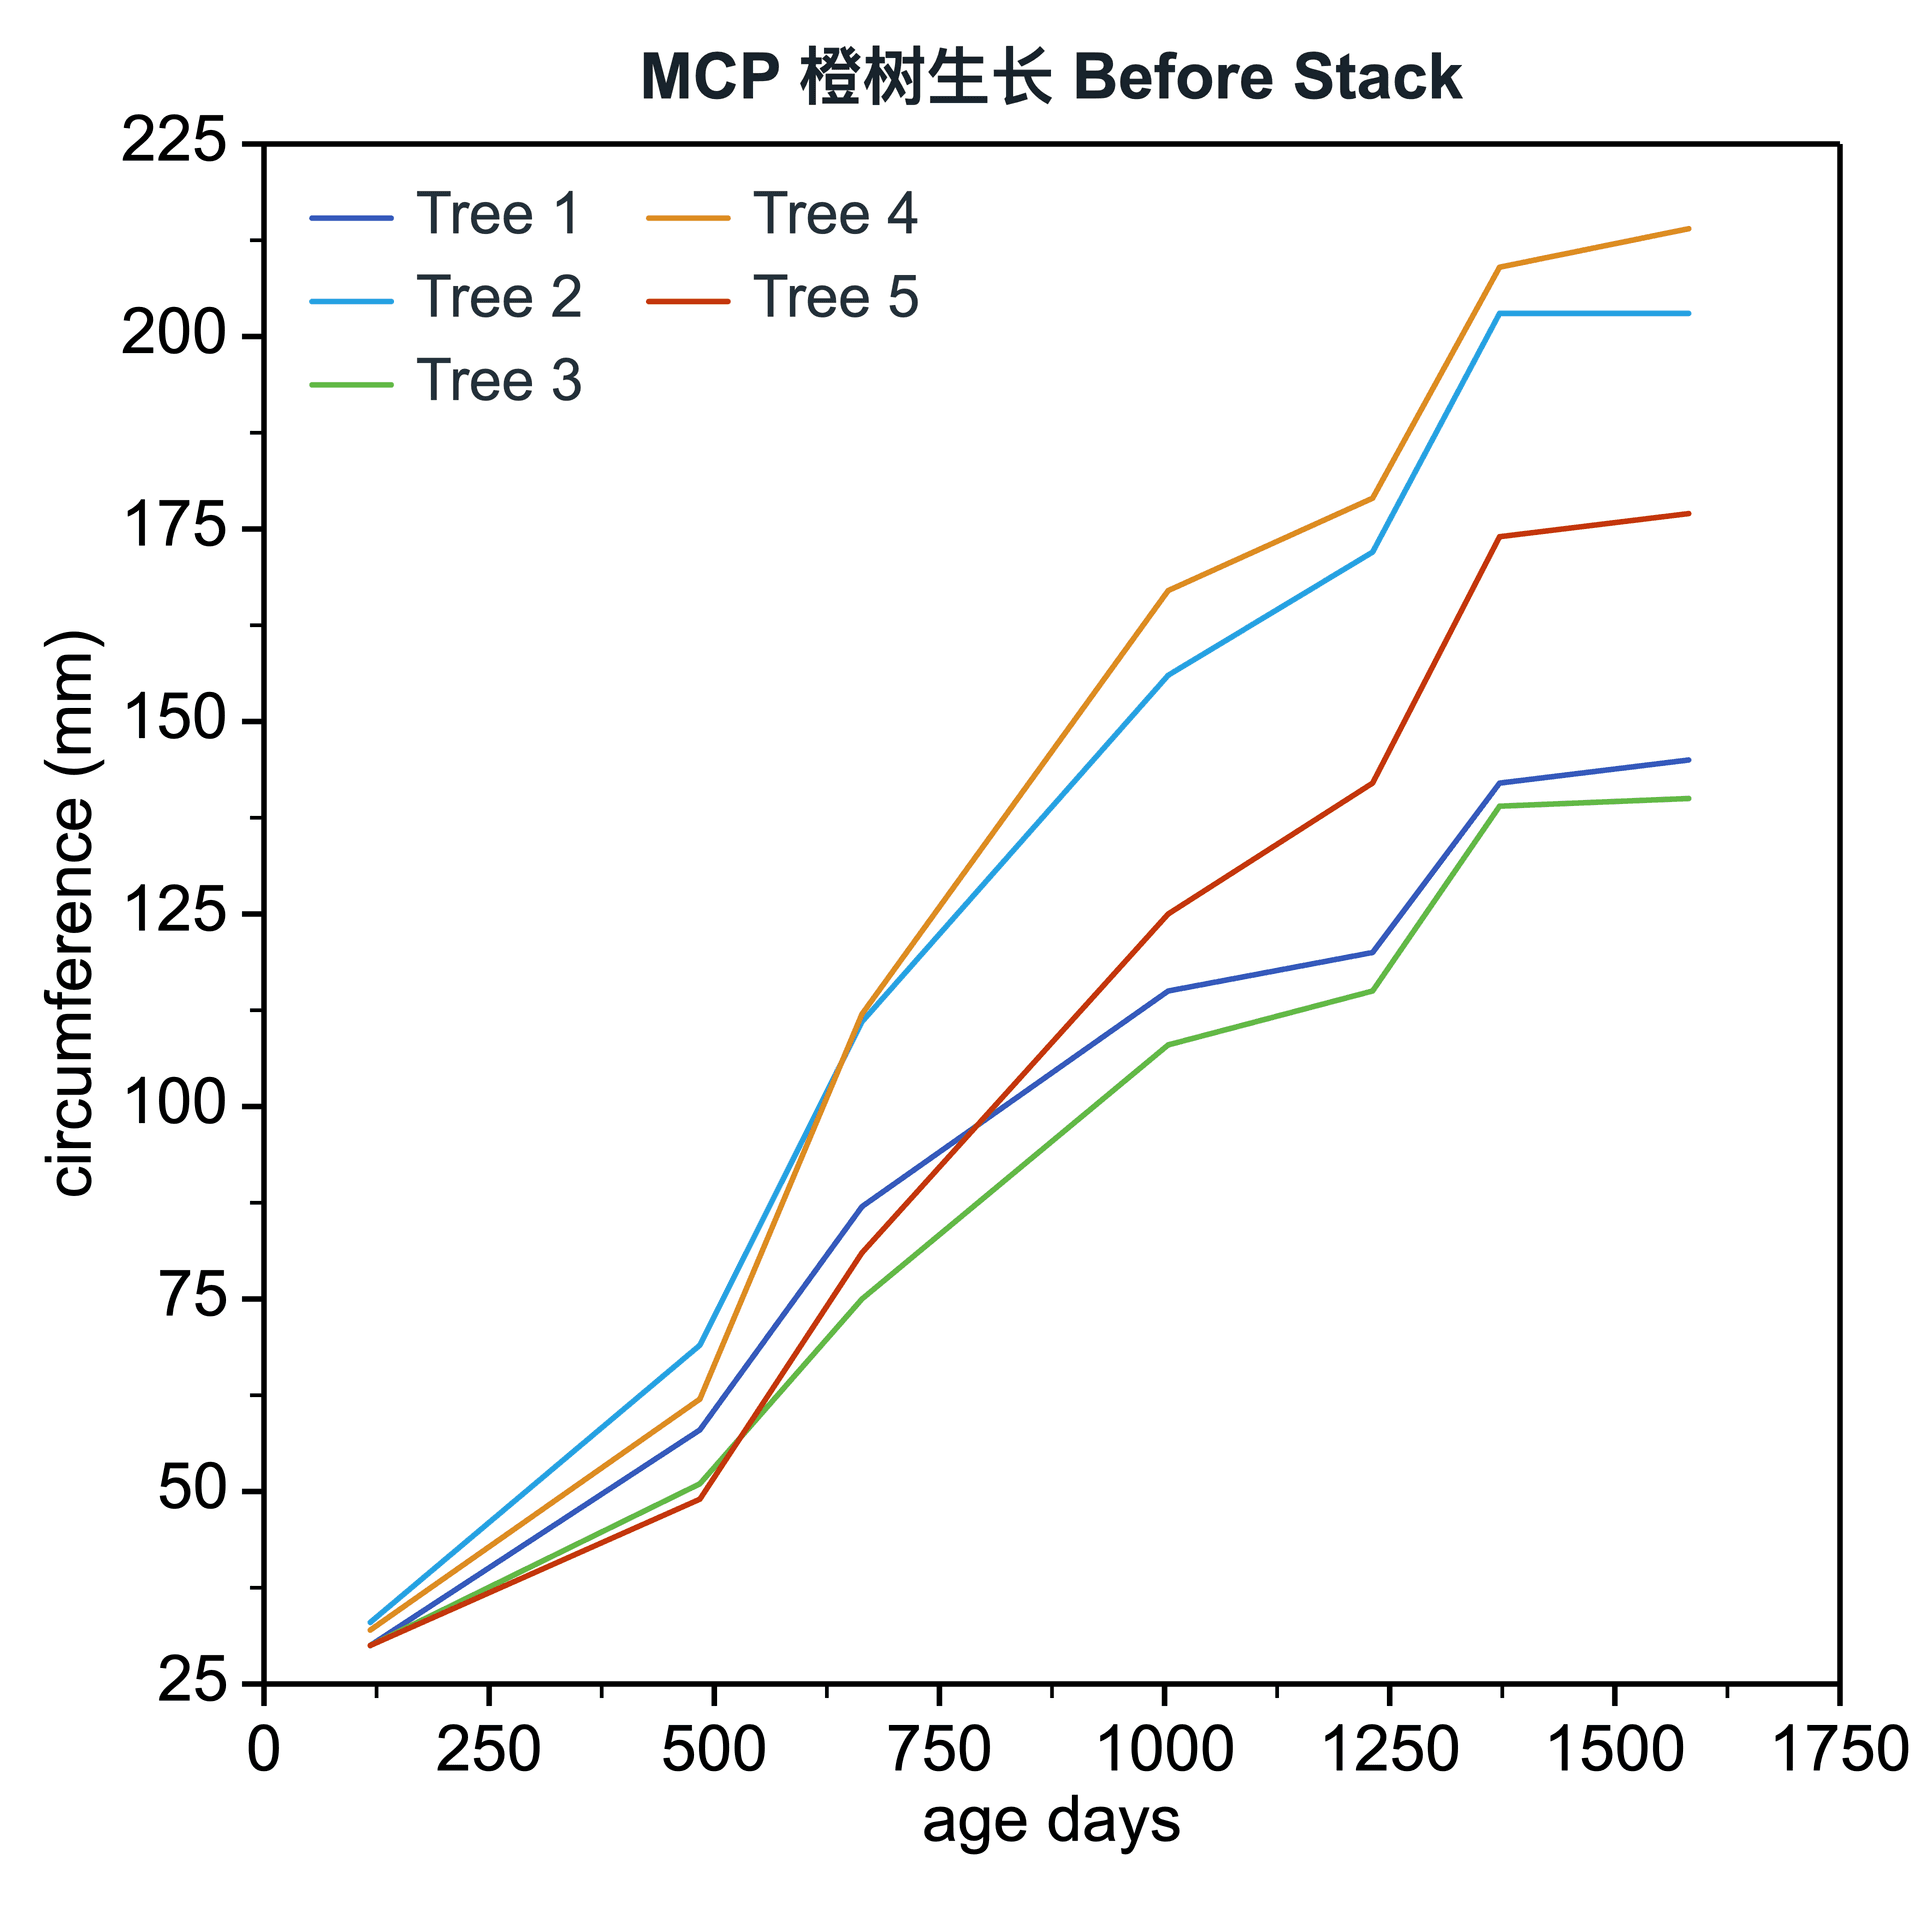
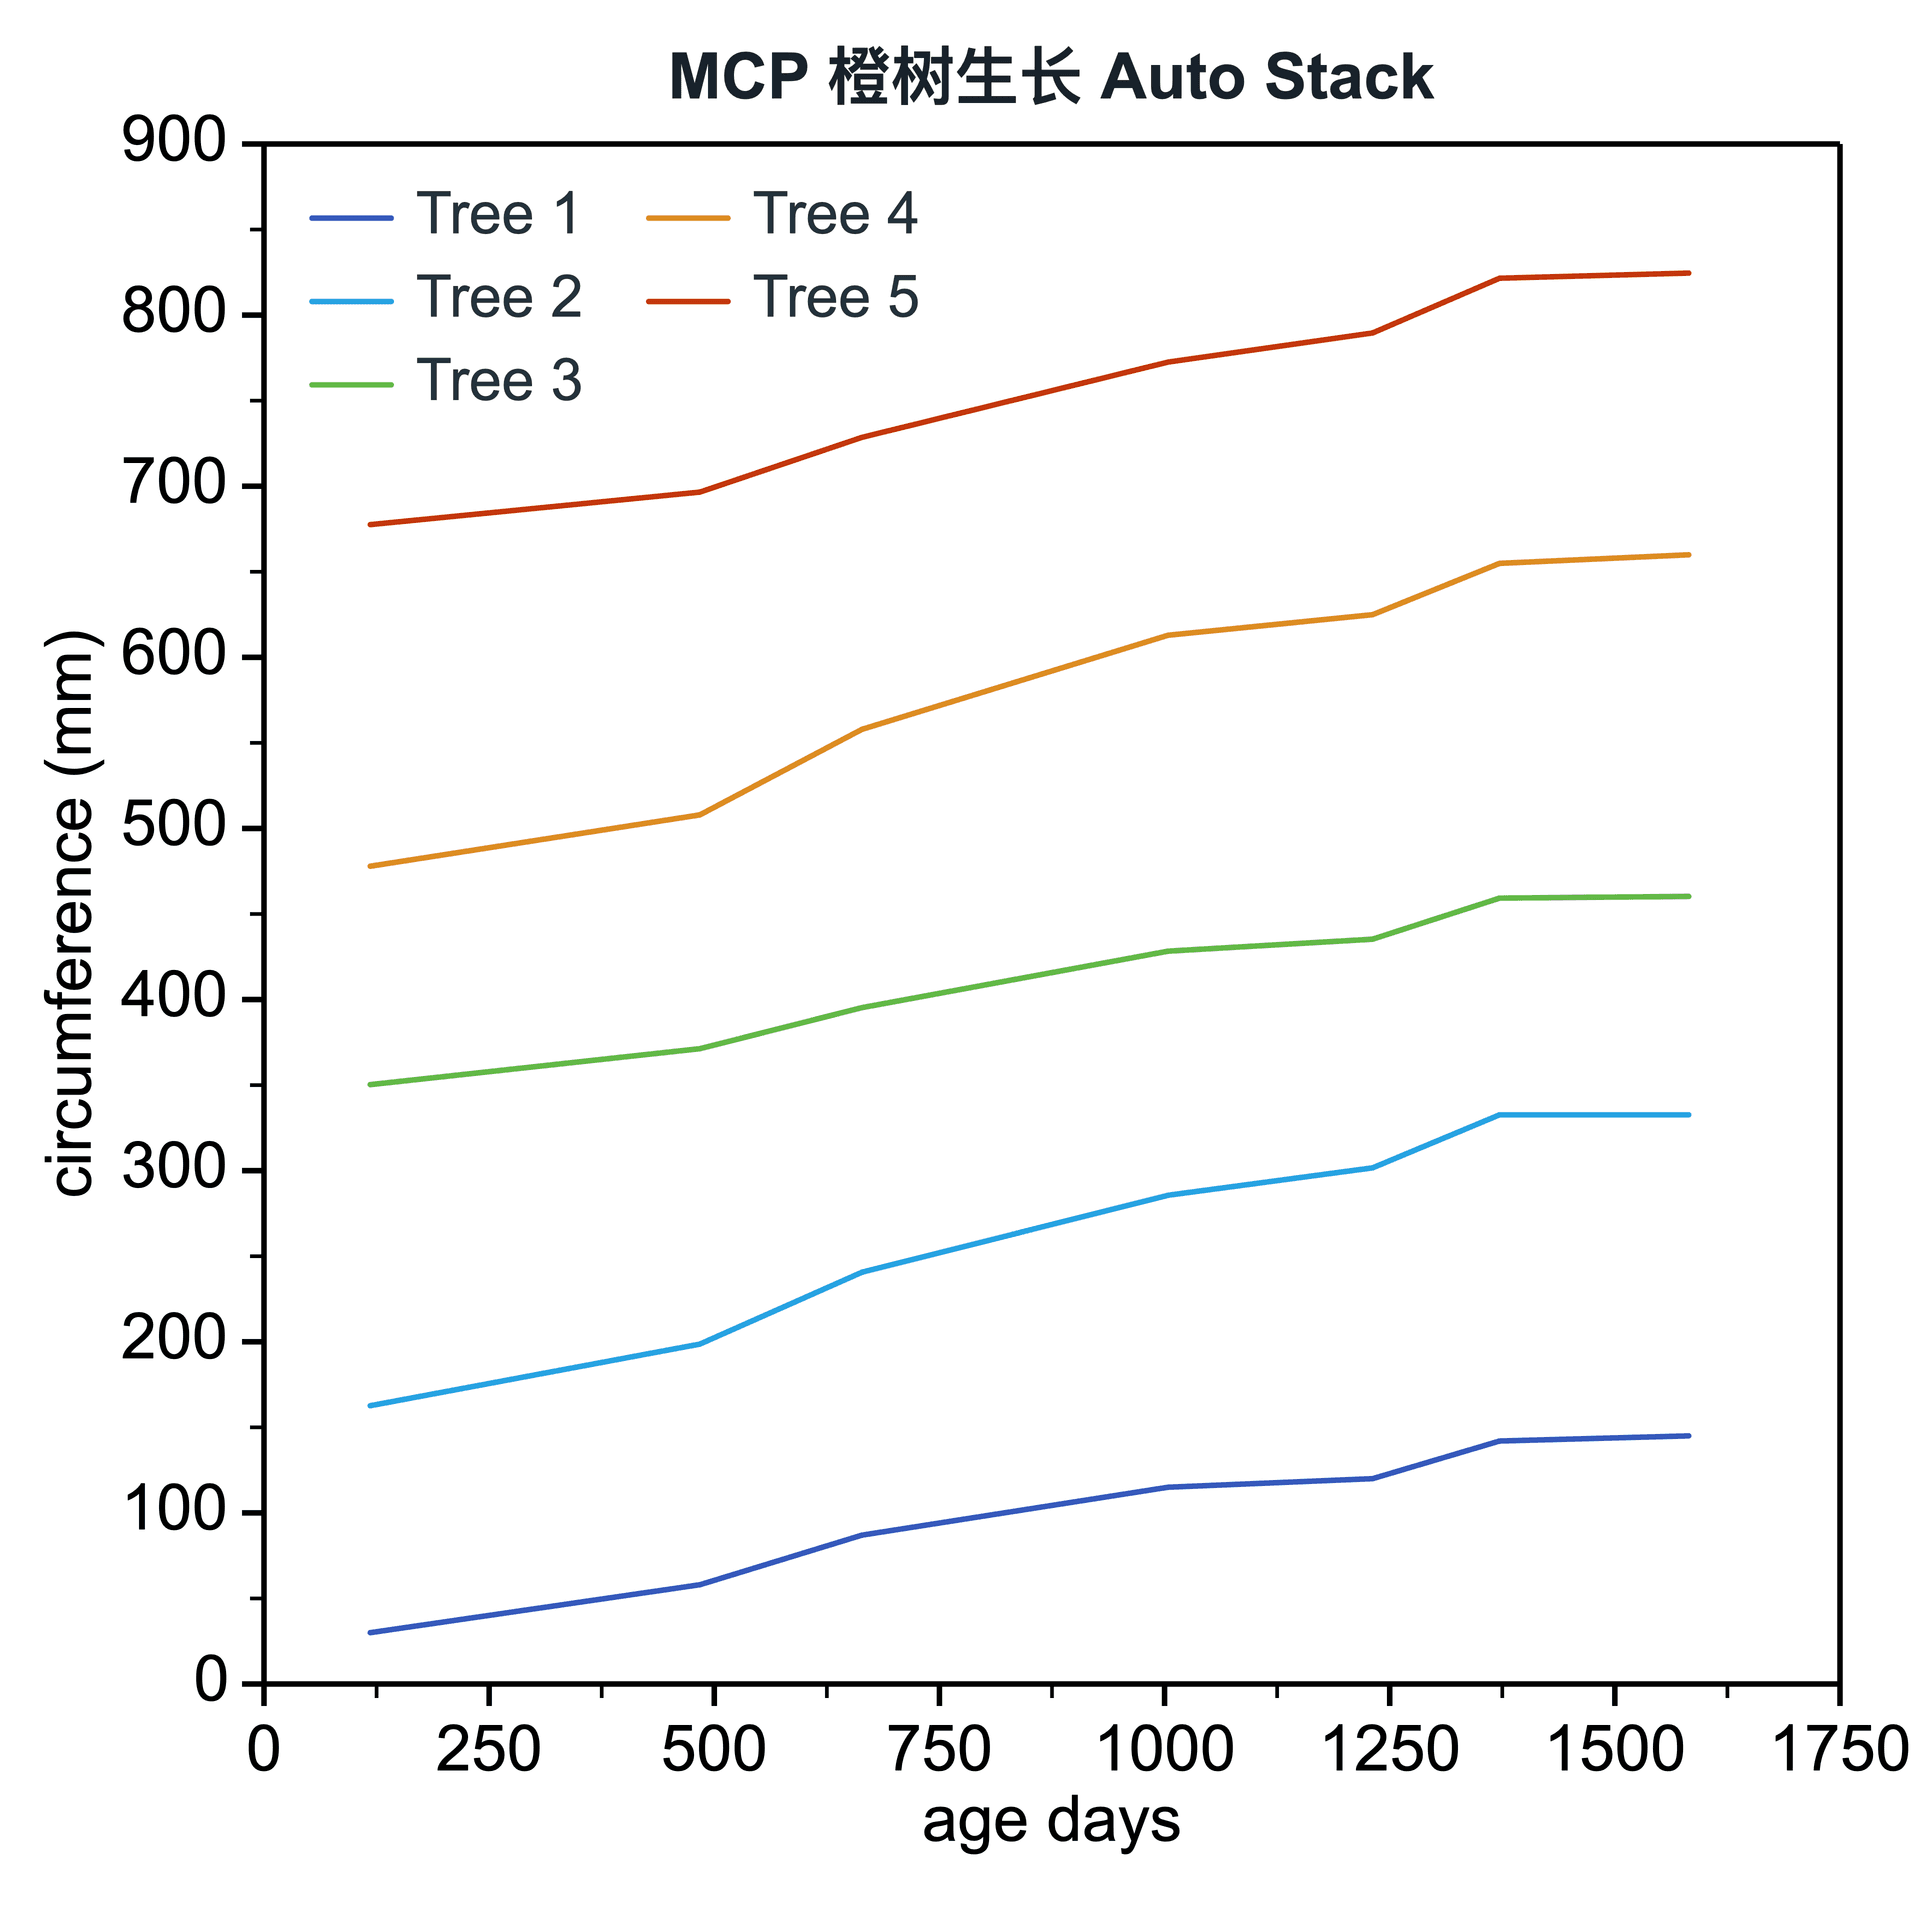
Auto Stack separates dense or overlapping curves by adding reversible display offsets. It does not create cumulative stacked values and does not rewrite the data table.
Prepare a directly mappable table
Use several line series with similar ranges or overlapping trajectories, such as spectra, time series, or repeated growth curves.
Prepare a normal line-plot table with one X column and at least two numeric Y series. The feature needs two or more offset-capable data lines.
Practice data · ordinary multi-Y line table
age_days
Tree 1
Tree 2
Tree 3
Tree 4
Tree 5
118
30
33
30
32
31
484
58
69
51
62
49
664
87
111
75
112
81
1004
115
156
108
167
125
1231
120
172
115
179
142
1372
142
203
139
209
174
Apply Auto Stack
Separate overlapping data lines with calculated X or Y display offsets while keeping the source measurements unchanged.
Step 1
Create the multi-line plot
Start from two or more line series, or choose Plot → Auto Stack Lines while creating the figure.
Auto STACKInterface preview · non-interactive
×
MenuPlot → Auto Stack Lines
Data range
Full table: 6 rows, 6 columns
Output
New figure
Add to existing figure
Auto STACKInterface preview · non-interactive
×
X mapping
Shared XPaired X-Y
X column
age_days · X⌄
Value columns
Tree 1–5 · Y⌄
Step 2
Choose the stack axis
Choose Auto Stack by Y for vertical separation or Auto Stack by X for horizontal separation.
Step 3
Confirm display offsets
Review the calculated spacing and confirm that the shifted axis is clearly understood as a display offset.
Auto STACKInterface preview · non-interactive
×
Error bars
None⌄
AUTO STACK
Stack direction
Stack by Y⌄
Spacing
Auto⌄
Auto STACKInterface preview · non-interactive
×
✓Shared X
Paired X-Y
✓Source data unchanged
Data tableOrange Tree Auto Stack data
Mapped columns6
Step 4
Restore when needed
Continue styling the lines, or use Reset Stack to return every series to its original display position.
Confirm that the data are unchanged before and after
Original display positionsAUTO STACK →Y display offsets applied
Settings and pre-export checks
Auto Stack by Y
Auto Stack by X
Automatic or fixed spacing
Offset summary
Per-series display offset
Reset all offsets
Offsets change only the display position; the source values remain unchanged.
Do not interpret the shifted vertical or horizontal positions as the original absolute values.
Use a clear caption or axis note when the figure will be read outside SmartPlot.
Reset the offsets whenever direct absolute comparison is required.