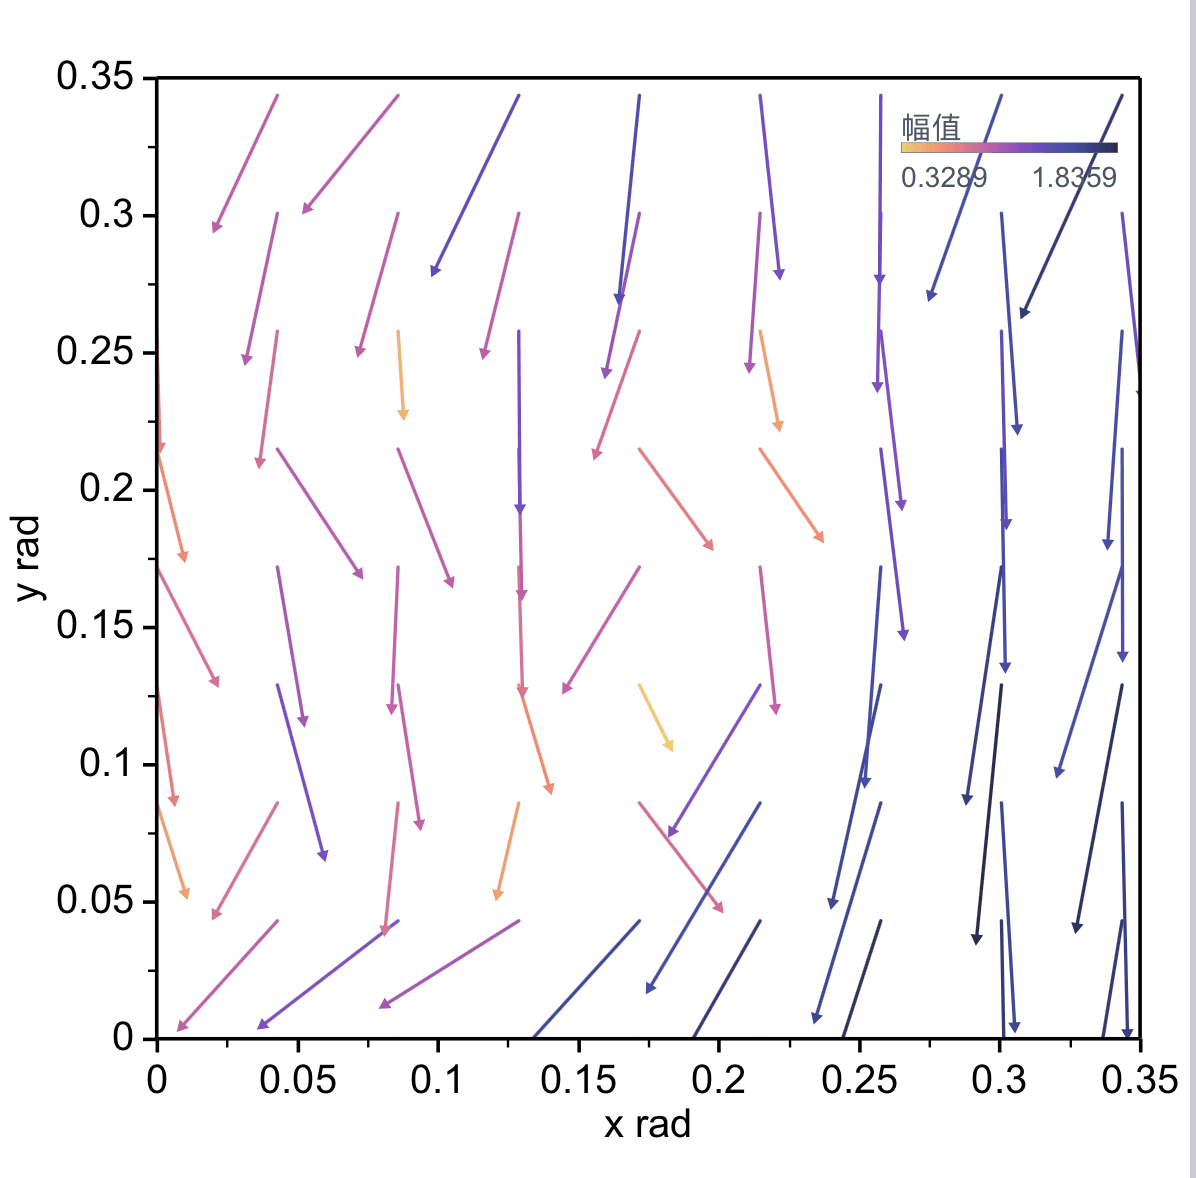
A quiver plot displays a two-dimensional vector field. Arrow position comes from X and Y, arrow direction comes from the vector components or angle, and arrow length represents vector magnitude.
Prepare a directly mappable table
Use quiver plots for velocity fields, force fields, gradients, flow direction, displacement, or any measurement with a 2D position and direction.
For component input, prepare numeric X, Y, U, and V columns. SmartPlot also supports magnitude-and-angle data and start/end-point data. Each row should describe one vector.
Practice data · illustrates column structure
x
y
u
v
0
0
1.0
0.2
1
0
0.8
0.5
0
1
0.4
0.9
1
1
-0.2
1.0
Create a quiver plot
Choose Quiver Plot, select how the vector data is stored, then map the position and vector columns. SmartPlot draws one arrow at every X/Y position.
Step 1
Choose range and output
Confirm the data range, then choose a new figure or add the plot to an existing figure.