Venn Diagram
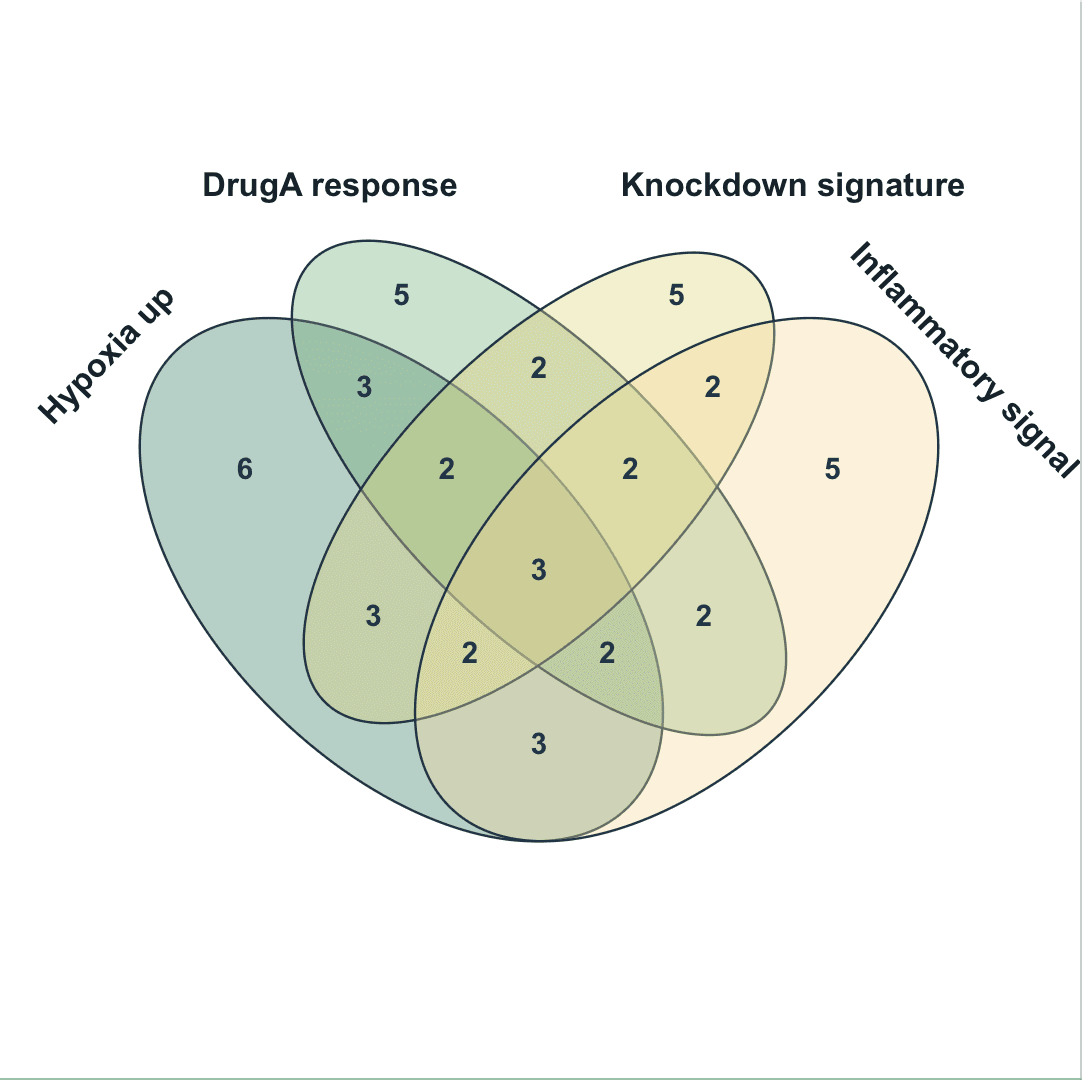 Venn diagram result
Create a Venn diagram
Select 2-4 set columns and SmartPlot calculates each exact member intersection.
Step 1Choose data range
Use the full table or current selection. Venn diagrams read non-empty unique text values from the selected columns.
Create Figure
venn_demo_4sets_smartplot
VENN DIAGRAM SETUP
Data RangeFull table: 24 rows, 4 columns
OutputNew Figure
Add to Existing Figure
Venn diagrams compare overlaps across 2-4 sets; non-empty unique values in each set column become members. Use UpSet for more than 4 sets later.
Hypoxia_up · Label Column, DrugA_response · Label Column +2⌃
✓Hypoxia_up · Label Column
✓DrugA_response · Label Column
✓Knockdown_signature · Label Column
✓Inflammatory_signal · Label Column
Select 2-4 columns; non-empty unique values in each column become one set.
Step 2Select set columns
Choose 2-4 columns as sets. Each column can be a gene list, sample list, or another member list.
Step 3Check member formatting
Remove accidental spaces and keep capitalization consistent so identical members match correctly.
4/4 setsHypoxia_up, DrugA_response, Knockdown_signature, Inflammatory_signal
Tablevenn_demo_4sets_smartplot
Mapped Columns4
4/4 setsHypoxia_up, DrugA_response, Knockdown_signature, Inflammatory_signal
Tablevenn_demo_4sets_smartplot
Mapped Columns4
Create and refine
Create the figure, then adjust circle or ellipse layout, set fill, border, labels, region text, and the intersection member table.
Click Create Figure when everything is ready.
Adjustable settings
These are the common settings for this plot type. For detailed line, marker, axis, legend, and font styling, see Styling.
- Set columns
- Circle or ellipse layout
- Set fill and border
- Set labels
- Region counts and percentages
- Intersection tooltip
Styling →