Tutorials
Follow SmartPlot tutorials for importing data, editing tables, creating scientific plot types, running analysis tools, styling figures, adding annotations, and exporting research-ready images.
Start
Getting Started
Import data, create your first plot, and learn the basic SmartPlot workflow.
TimeAB01822103138
Data
Data Editing
Organize tables, select ranges, sort, clean, and generate basic data.
#XY1-1.00.422-0.80.51
SortCleanGenerate
Plot
Plotting
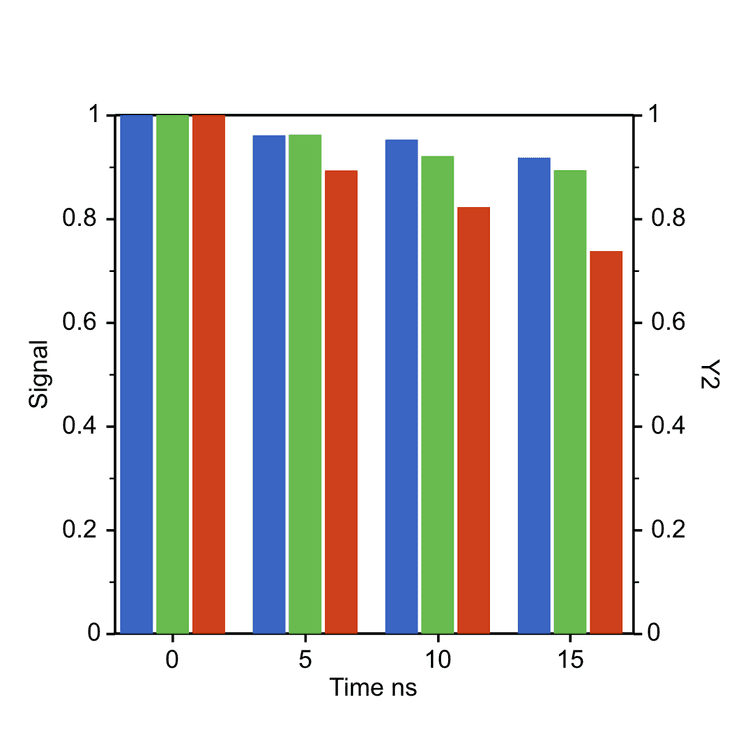
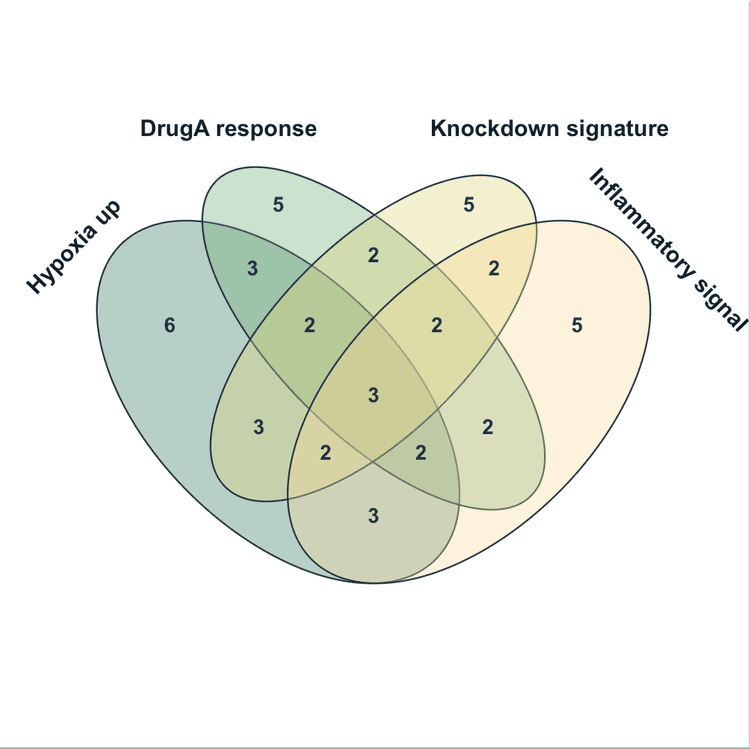
Learn how to create line, scatter, bar, histogram, box, and 2D color map plots.


Style
Style Functions
Adjust colors, fonts, axes, legends, and visual styles for papers and reports.
Analysis
Analysis Functions
Use baseline correction, Shirley background, peak fitting, and trend fitting tools.
View tutorial →
Annotate
Add Elements
Add text, arrows, reference lines, shapes, and notes to explain results clearly.
View tutorial →
Export
Export & Save
Export figures as images, PDF, vector formats, or save projects for later editing.
PNGSVGPDF