Add Elements
Add reference lines, text notes, arrows, highlighted regions, and editable graphic objects to a figure. After adding an element, move it on the canvas or refine its appearance in the right-side style panel.
Insert elements from the top Add menu or the canvas context menu. Select an element to show its position and style settings in the right panel.
How to add
Choose elements from the top Add menu or the canvas context menu.
Lines & References
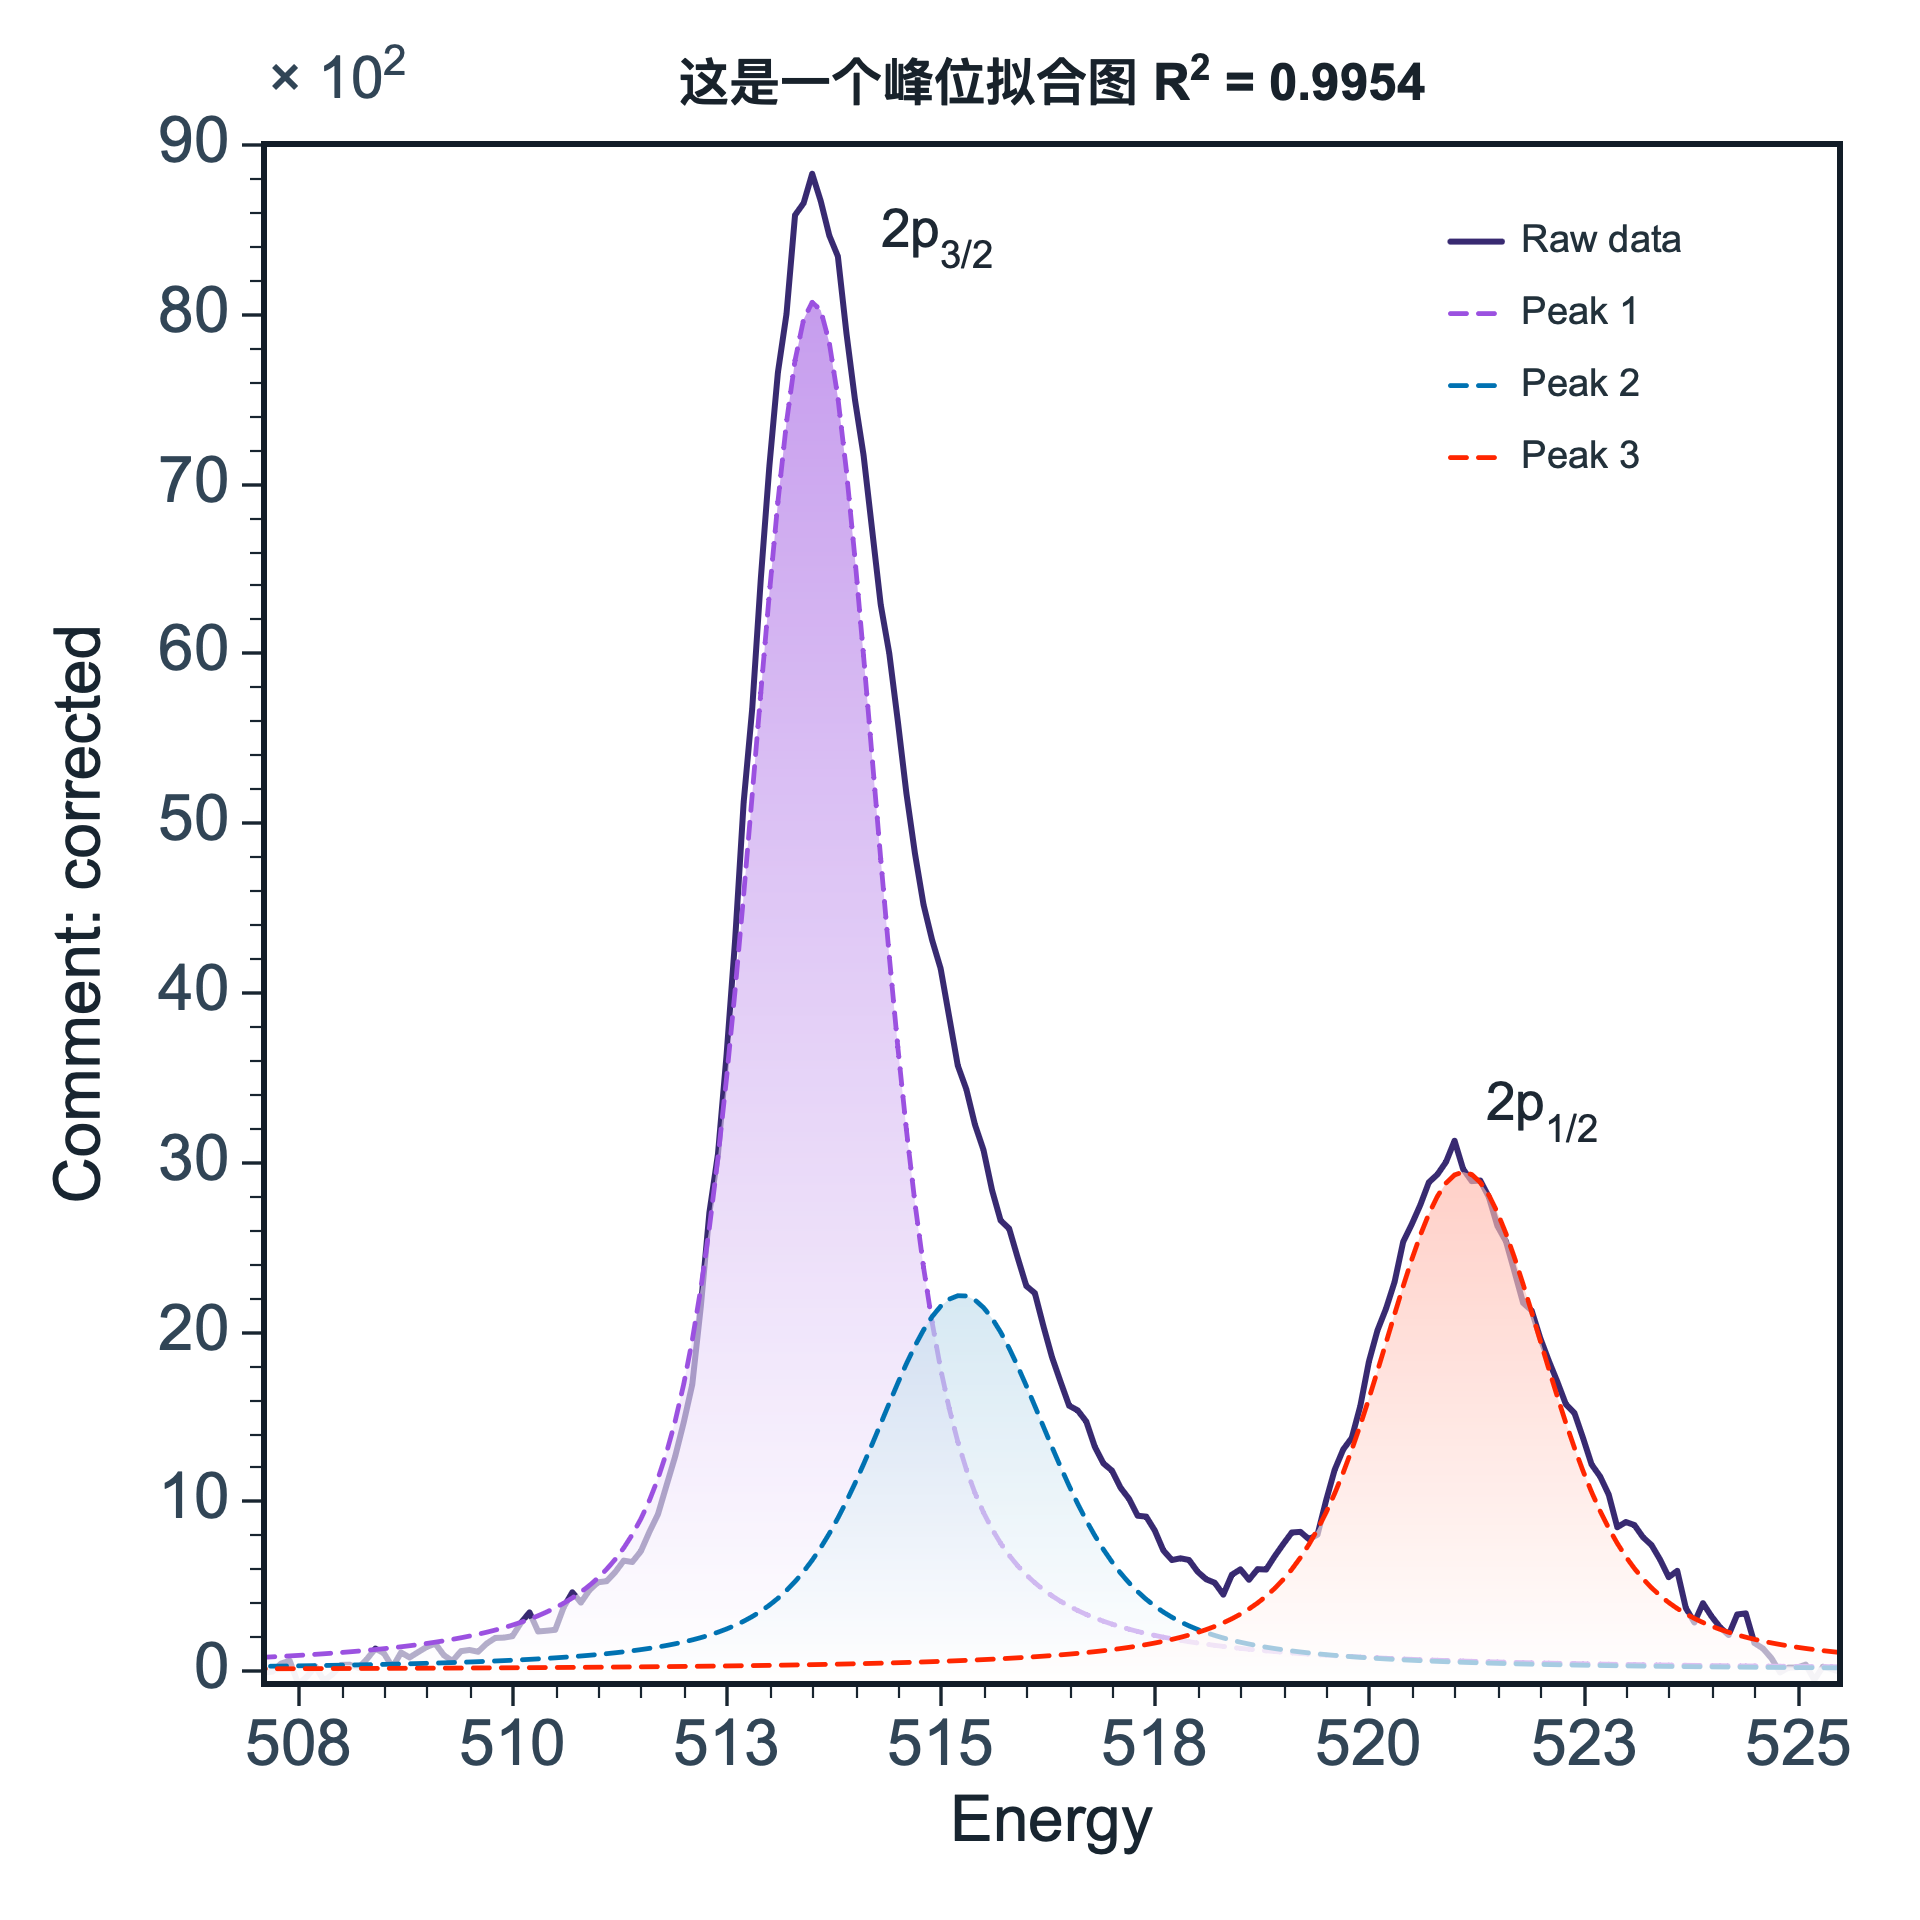
Reference lines, stick patternsMark peak positions, thresholds, critical points, or standard spectra.
Annotations
Text, arrows, highlighted regionsExplain important information such as peak names, outliers, or key intervals.
Graphic Elements
Rectangles, circles, legends, titlesFrame regions, complete layout, and refine legends or titles.
Top Add menu
Open Add from the top toolbar when inserting elements during the main plotting workflow.
Canvas right-click menu
Right-click on the plotting canvas and use Add to insert common elements directly in context.
 Text content panel
How to move and edit
After adding an element, click it to select it. Move it on the canvas or continue editing in the right-side style panel.
Click the element
Select text, arrows, reference lines, or graphic objects in the figure.
Drag directly
Text, arrows, rectangles, circles, reference lines, and legends can be moved on the canvas.
Use the right panel
Adjust font, color, line style, opacity, ranges, and layer order.
Show, lock, or delete
Control visibility, lock an object, or delete it when it is no longer needed.
Position & rangePosition, start/end, X/Y values, ranges
Text & labelsContent, font, size, bold/italic, alignment
Lines & colorColor, line width, style, fill, opacity
Object stateShow/hide, lock, layer order, delete
Common use cases
When you are unsure what to add, choose by goal.
Mark peaks or thresholds
Reference line, text, arrowUse for peak positions, critical points, thresholds, or a specific X/Y location.
Compare standard spectra
Reference stick patternUseful for XRD, Raman, XPS, and other standard peak comparisons.
Emphasize a range
Highlight, rectangle, circleMark a peak window, integration interval, outlier region, or local area.
Polish figure layout
Legend, title, textRefine legends, add notes, or keep publication titles consistent.
Smart command examples
Smart commands are useful for quick lightweight additions. Use the Add menu or context menu for complex objects.
Show smart command examples
| Action | Example command |
|---|---|
| Add text | /add text "Order 1" |
| Add a vertical reference line | /add vertical line at x=5 |
| Add an arrow | /add arrow |
| Add a rectangle | /add rectangle |
| Add a circle | /add circle |