Dual Y Bar Chart
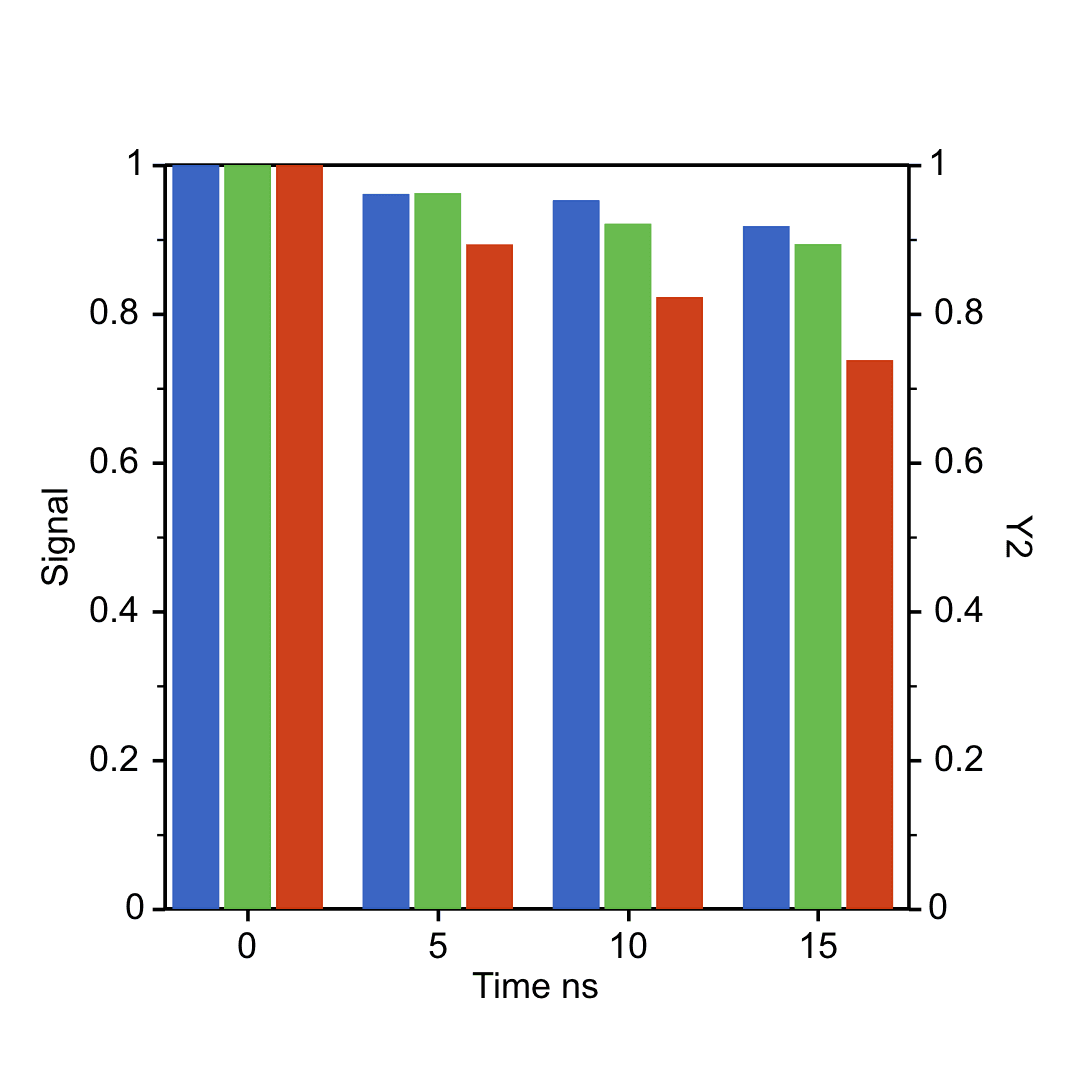 Dual Y bar result
Create a dual Y bar chart
Map the category and value columns, then assign each bar series to Left Y or Right Y.
Step 1Choose data range
Use the full table or current selection, then create a new figure or add to an existing one.
Data RangeFull table: 12 rows, 5 columns
OutputNew Figure
Add to Existing Figure
VerticalHorizontal
Horizontal: categories on Y, values on X.
BasicGrouped
Outer GroupColumn: Vd (V) · X⌄
Inner CategoryY column titles⌄
Choose direction and structure
Choose vertical or horizontal orientation, then choose normal or grouped mode.
Step 3Map category and value columns
Select the category column and the value columns. Each value series can belong to the left or right Y axis.
Value ColumnsVg 0V (uA) · Y1, Vg 10V (uA) · ...⌄
Y Axis AssignmentRight Y creates a Y2 axis when the figure is created.
Step 4Assign Y axes
Keep comparable values on the same side. After creation, refine both axes, legends, and plot-frame spacing.
Click Create Figure when everything is ready.
Adjustable settings
These are the common settings for this plot type. For detailed line, marker, axis, legend, and font styling, see Styling.
- Vertical or horizontal direction
- Normal or grouped bars
- Category column
- Value columns
- Left Y / Right Y assignment
- Axis range and title
Styling →