WHAT’S NEW?
SmartPlot V1.7 release
SmartPlot 1.7 adds bubble charts and complete two-factor statistics while bringing major upgrades to large-data plotting, heatmaps, batch export, and professional multi-panel composition.
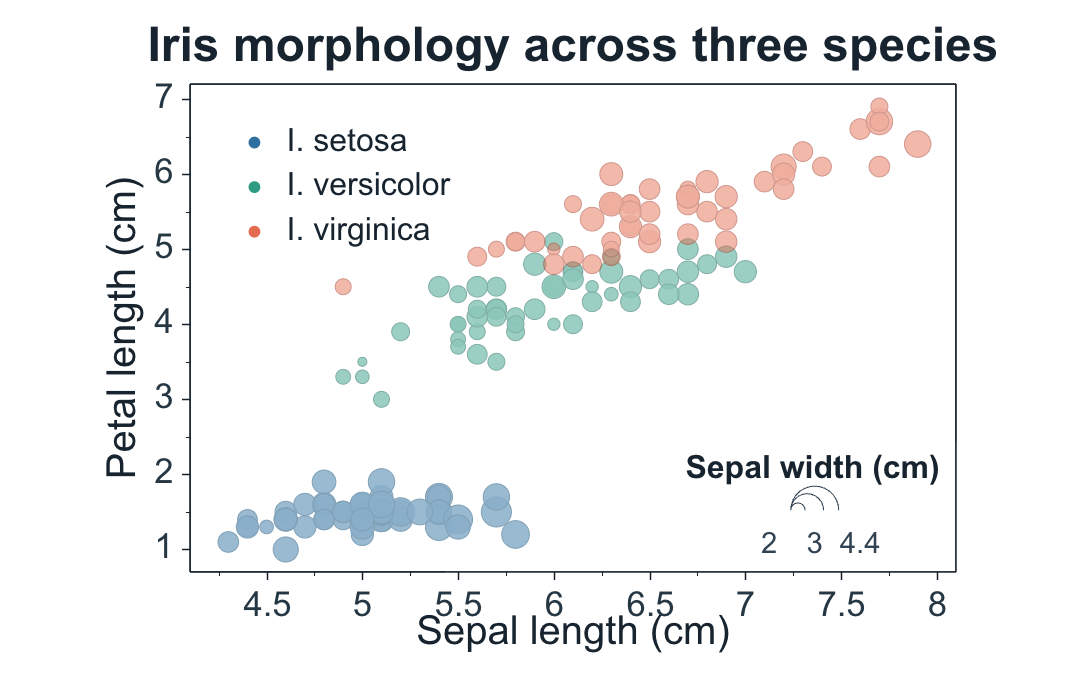
Bubble charts turn a third variable into visual scale
The new bubble chart maps a third numeric variable to symbol size while keeping the familiar SmartPlot scatter-plot workflow and publication-ready styling controls.
- Choose area, radius, or logarithmic size mapping to match the meaning and range of the data.
- Add a customizable bubble-size scale so readers can interpret symbol sizes directly.
- Fine-tune bubble-scale styling and series opacity for dense scientific datasets.
- Release example: Fisher’s Iris dataset from the UCI Machine Learning Repository (CC BY 4.0).
Batch export packages multiple figures in one run
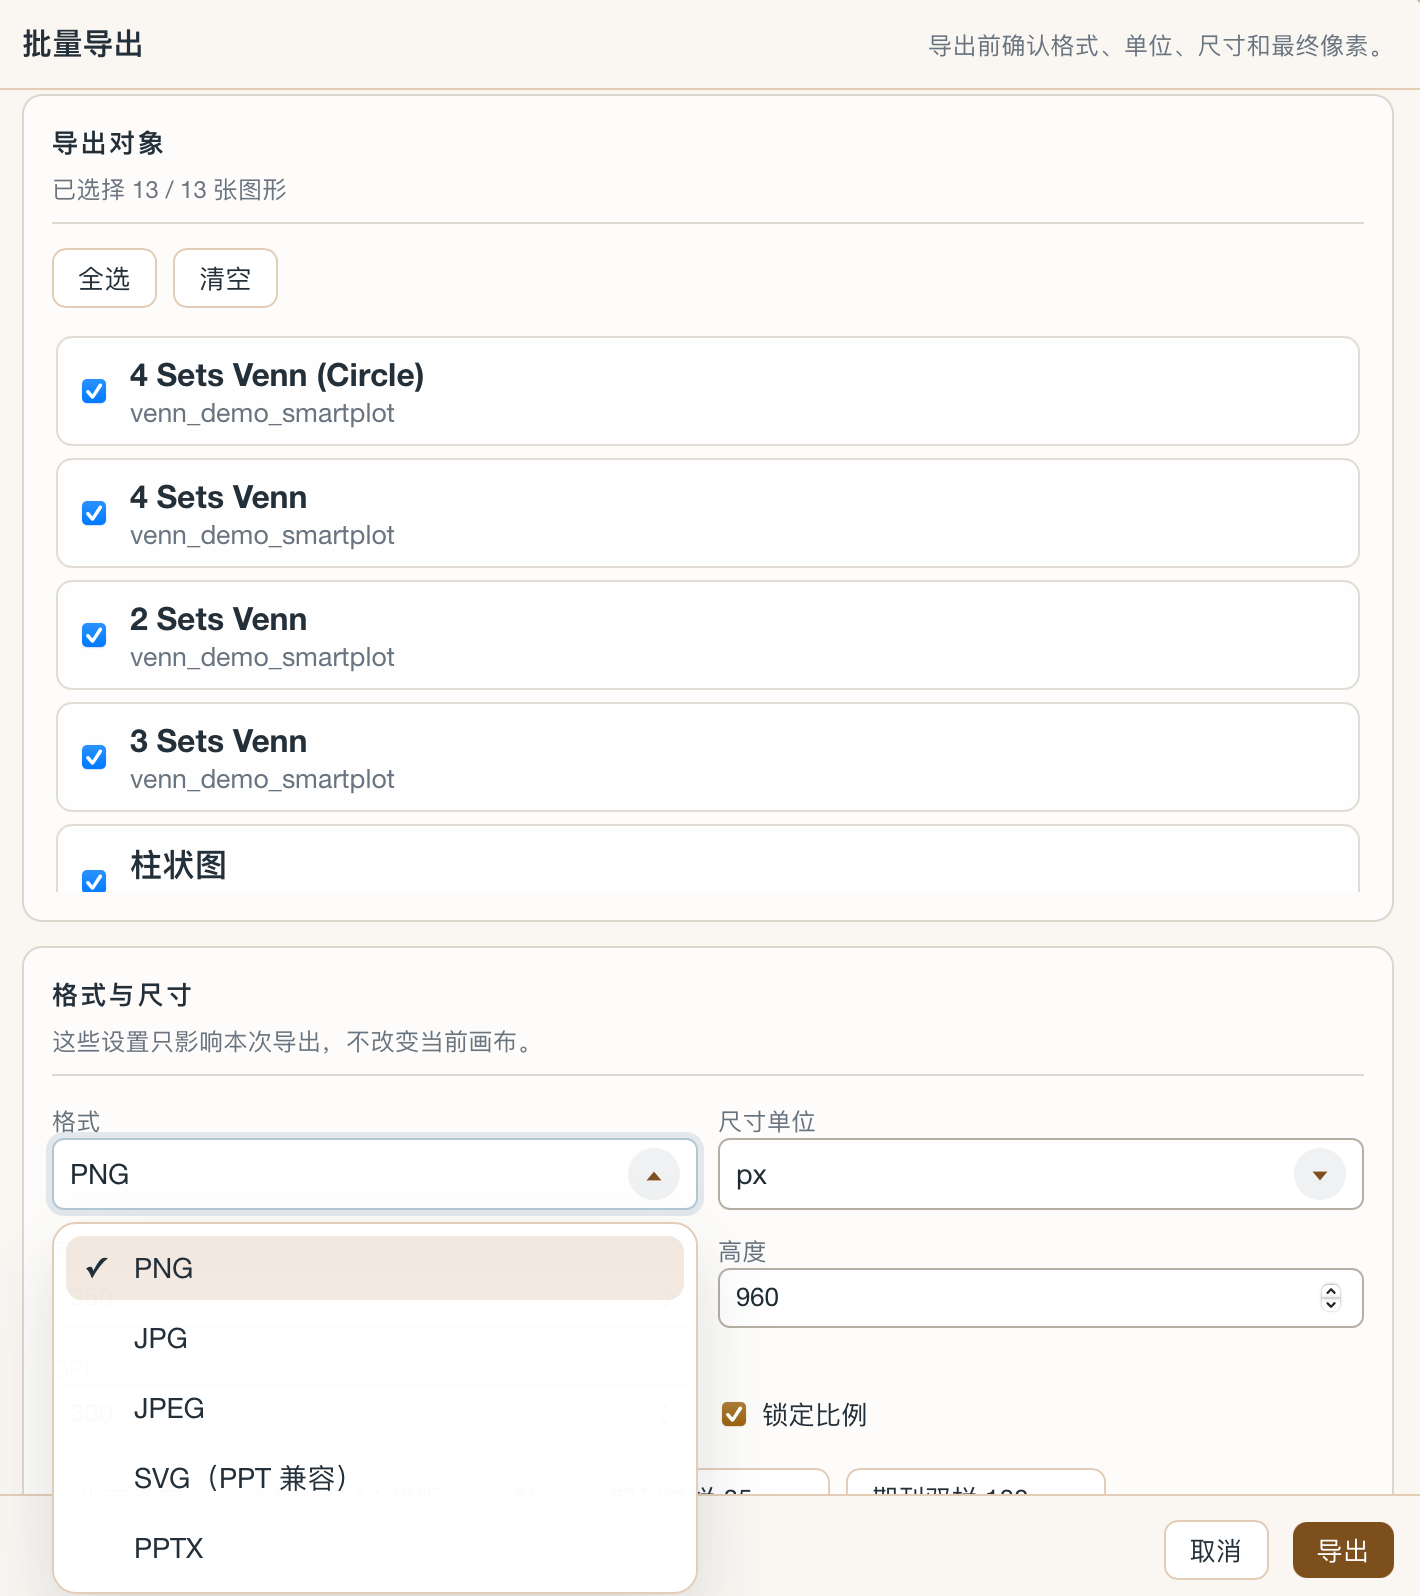
Select several figures once, apply one export format and size, and let SmartPlot prepare the complete set without opening each figure individually.
- Export selected figures as PNG, JPG, SVG, or PPTX from one dialog.
- Each figure follows the existing single-figure export rules and is collected into one ZIP package.
- Oversized raster safeguards reduce failures caused by extreme pixel dimensions.
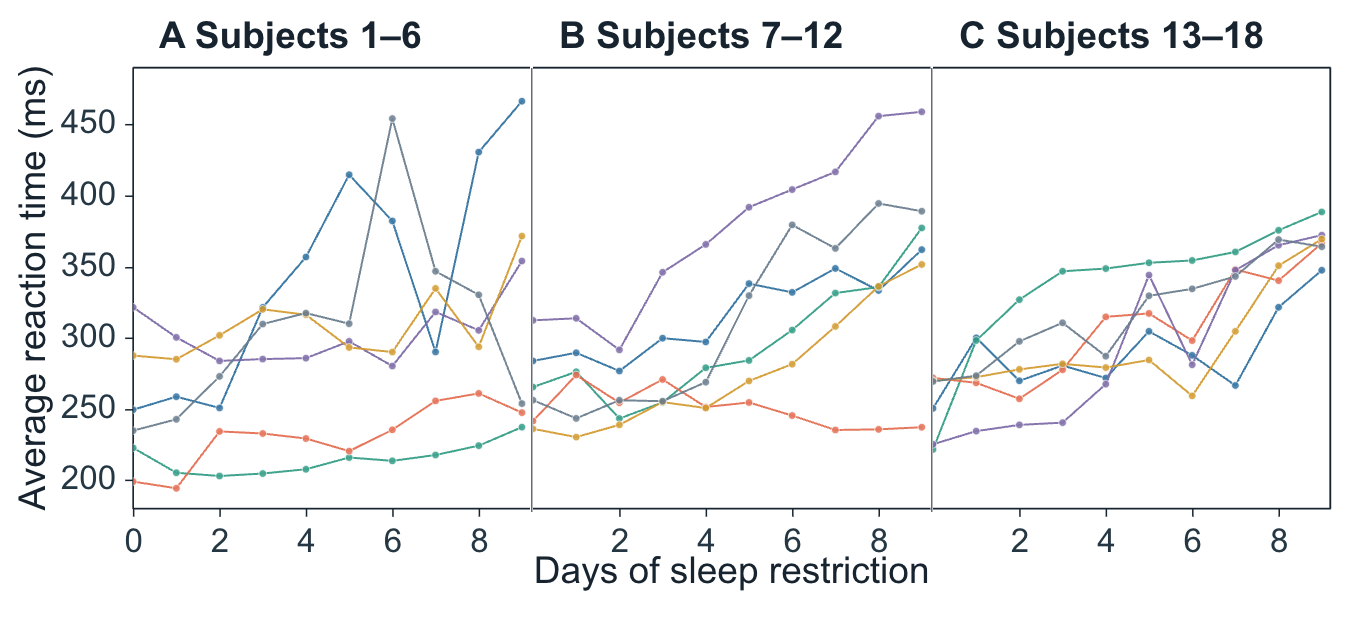
Compact composition removes repetition between panels
New compact-layout controls make adjacent plots read as one coordinated figure by sharing borders, hiding repeated axis text, and tightening panel spacing.
- Hide repeated axis labels and tick text while preserving the outer labels readers need.
- Share neighboring plot borders and control horizontal and vertical gaps independently.
- Build 1×5 or custom grids with custom page sizes and reference-based canvas or plot-frame matching.
- Release example: 18 individual reaction-time trajectories from the Belenky et al. (2003) sleep-restriction study.
Two-factor significance analysis stays connected to the plot
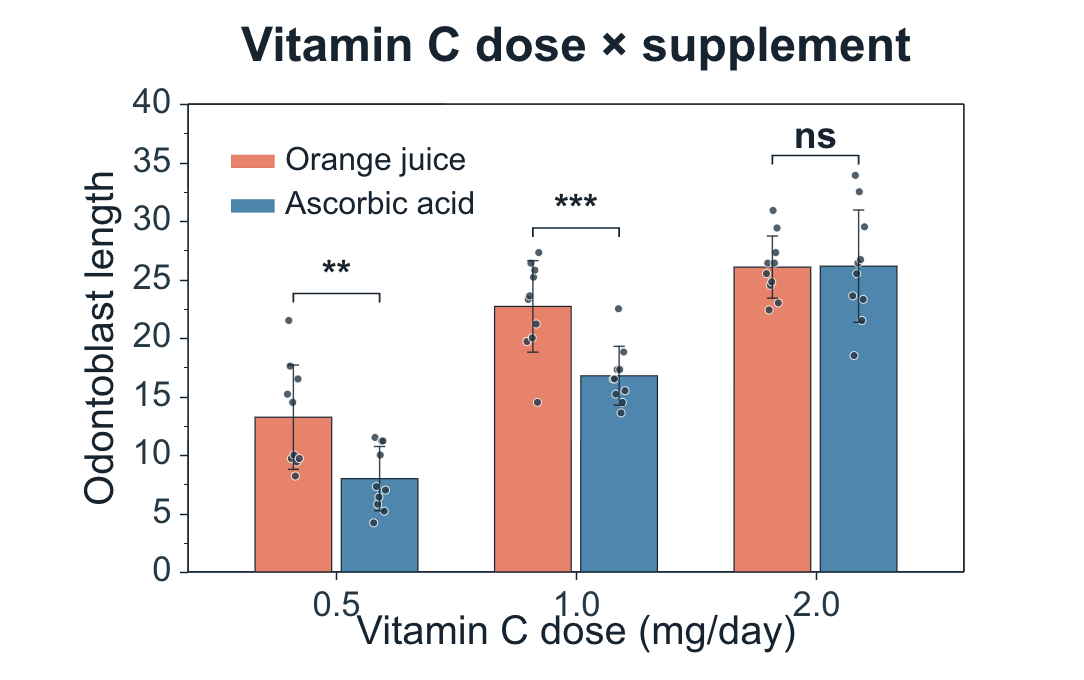
Grouped bar and box plots can now run ordinary two-way ANOVA and carry the statistical result into publication-ready comparisons and annotations.
- Evaluate both main effects and the factor interaction from complete two-factor designs.
- Run simple-effects comparisons within the relevant factor family.
- Apply multiplicity correction and place significance brackets directly on bar or box plots.
- Release example: the R ToothGrowth dataset, based on Crampton’s 1947 vitamin C study.
Heatmaps and large datasets are easier to interpret and edit
V1.7 strengthens matrix semantics and large-data rendering so imported scientific tables are recognized more accurately and stay responsive during exploration.
- Heatmaps support numeric, categorical, and automatic axes, X/Y transpose, and sparse-matrix import.
- Scientific-data import better recognizes missing values, scientific notation, and numeric columns containing sparse text.
- Tiered previews, point budgets, and memory-bounded caches keep large-data interaction smoother.
Heatmaps and large datasets are easier to interpret and edit
V1.7 strengthens matrix semantics and large-data rendering so imported scientific tables are recognized more accurately and stay responsive during exploration.
- Heatmaps support numeric, categorical, and automatic axes, X/Y transpose, and sparse-matrix import.
- Scientific-data import better recognizes missing values, scientific notation, and numeric columns containing sparse text.
- Tiered previews, point budgets, and memory-bounded caches keep large-data interaction smoother.
Also included in V1.7
Bubble charts support area, radius, and logarithmic size mapping plus a customizable bubble-size scale.
Bar and box plots support two-way ANOVA, interactions, simple effects, and multiplicity correction.
Tiered previews, point budgets, and memory-bounded caching improve large-data plotting and analysis stability.
Heatmaps support numeric, categorical, and automatic axes, X/Y transpose, and sparse-matrix import.
Scientific-data import better recognizes missing values, scientific notation, and numeric columns containing sparse text.
Batch export creates PNG, JPG, SVG, or PPTX output for multiple selected figures with oversized-image safeguards.
Compact composition hides repeated axis text, shares neighboring borders, and separates horizontal and vertical gap controls.
Composition layouts now support 1×5, custom rows and columns, custom page sizes, and reference-based canvas and plot-frame matching.
Composition-wide polishing unifies colors, backgrounds, axes, typography, and panel labels across selected plots.
Composite SVG/PPT export better preserves subplot relationships, text scale, optical stroke weight, and editable elements.
Custom legends now use a dedicated editing dialog for text, symbols, colors, visibility, and live preview.
Advanced object editing adds finer control of bubble scales, per-segment broken-axis ticks, and series opacity.
Past News
SmartPlot V1.65
July 5, 2026SVG/PPT reliability, richer peak-fit tables, editable inset zooms, large-data input, and Bruker RAW import.
Issue 1.6SmartPlot V1.6
June 25, 2026Group figures, Venn diagrams, dual-Y and horizontal charts, unit editing, and export compatibility.
Issue 1.55SmartPlot V1.55
June 15, 2026Standalone radar charts, visual Add tools, marquee selection, data import append/replace, and fill patterns.
Issue 1.5SmartPlot V1.5
June 9, 2026Axis frame control, inset zoom, significance analysis, and chart interaction fixes.