WHAT’S NEW?
SmartPlot V1.55 release
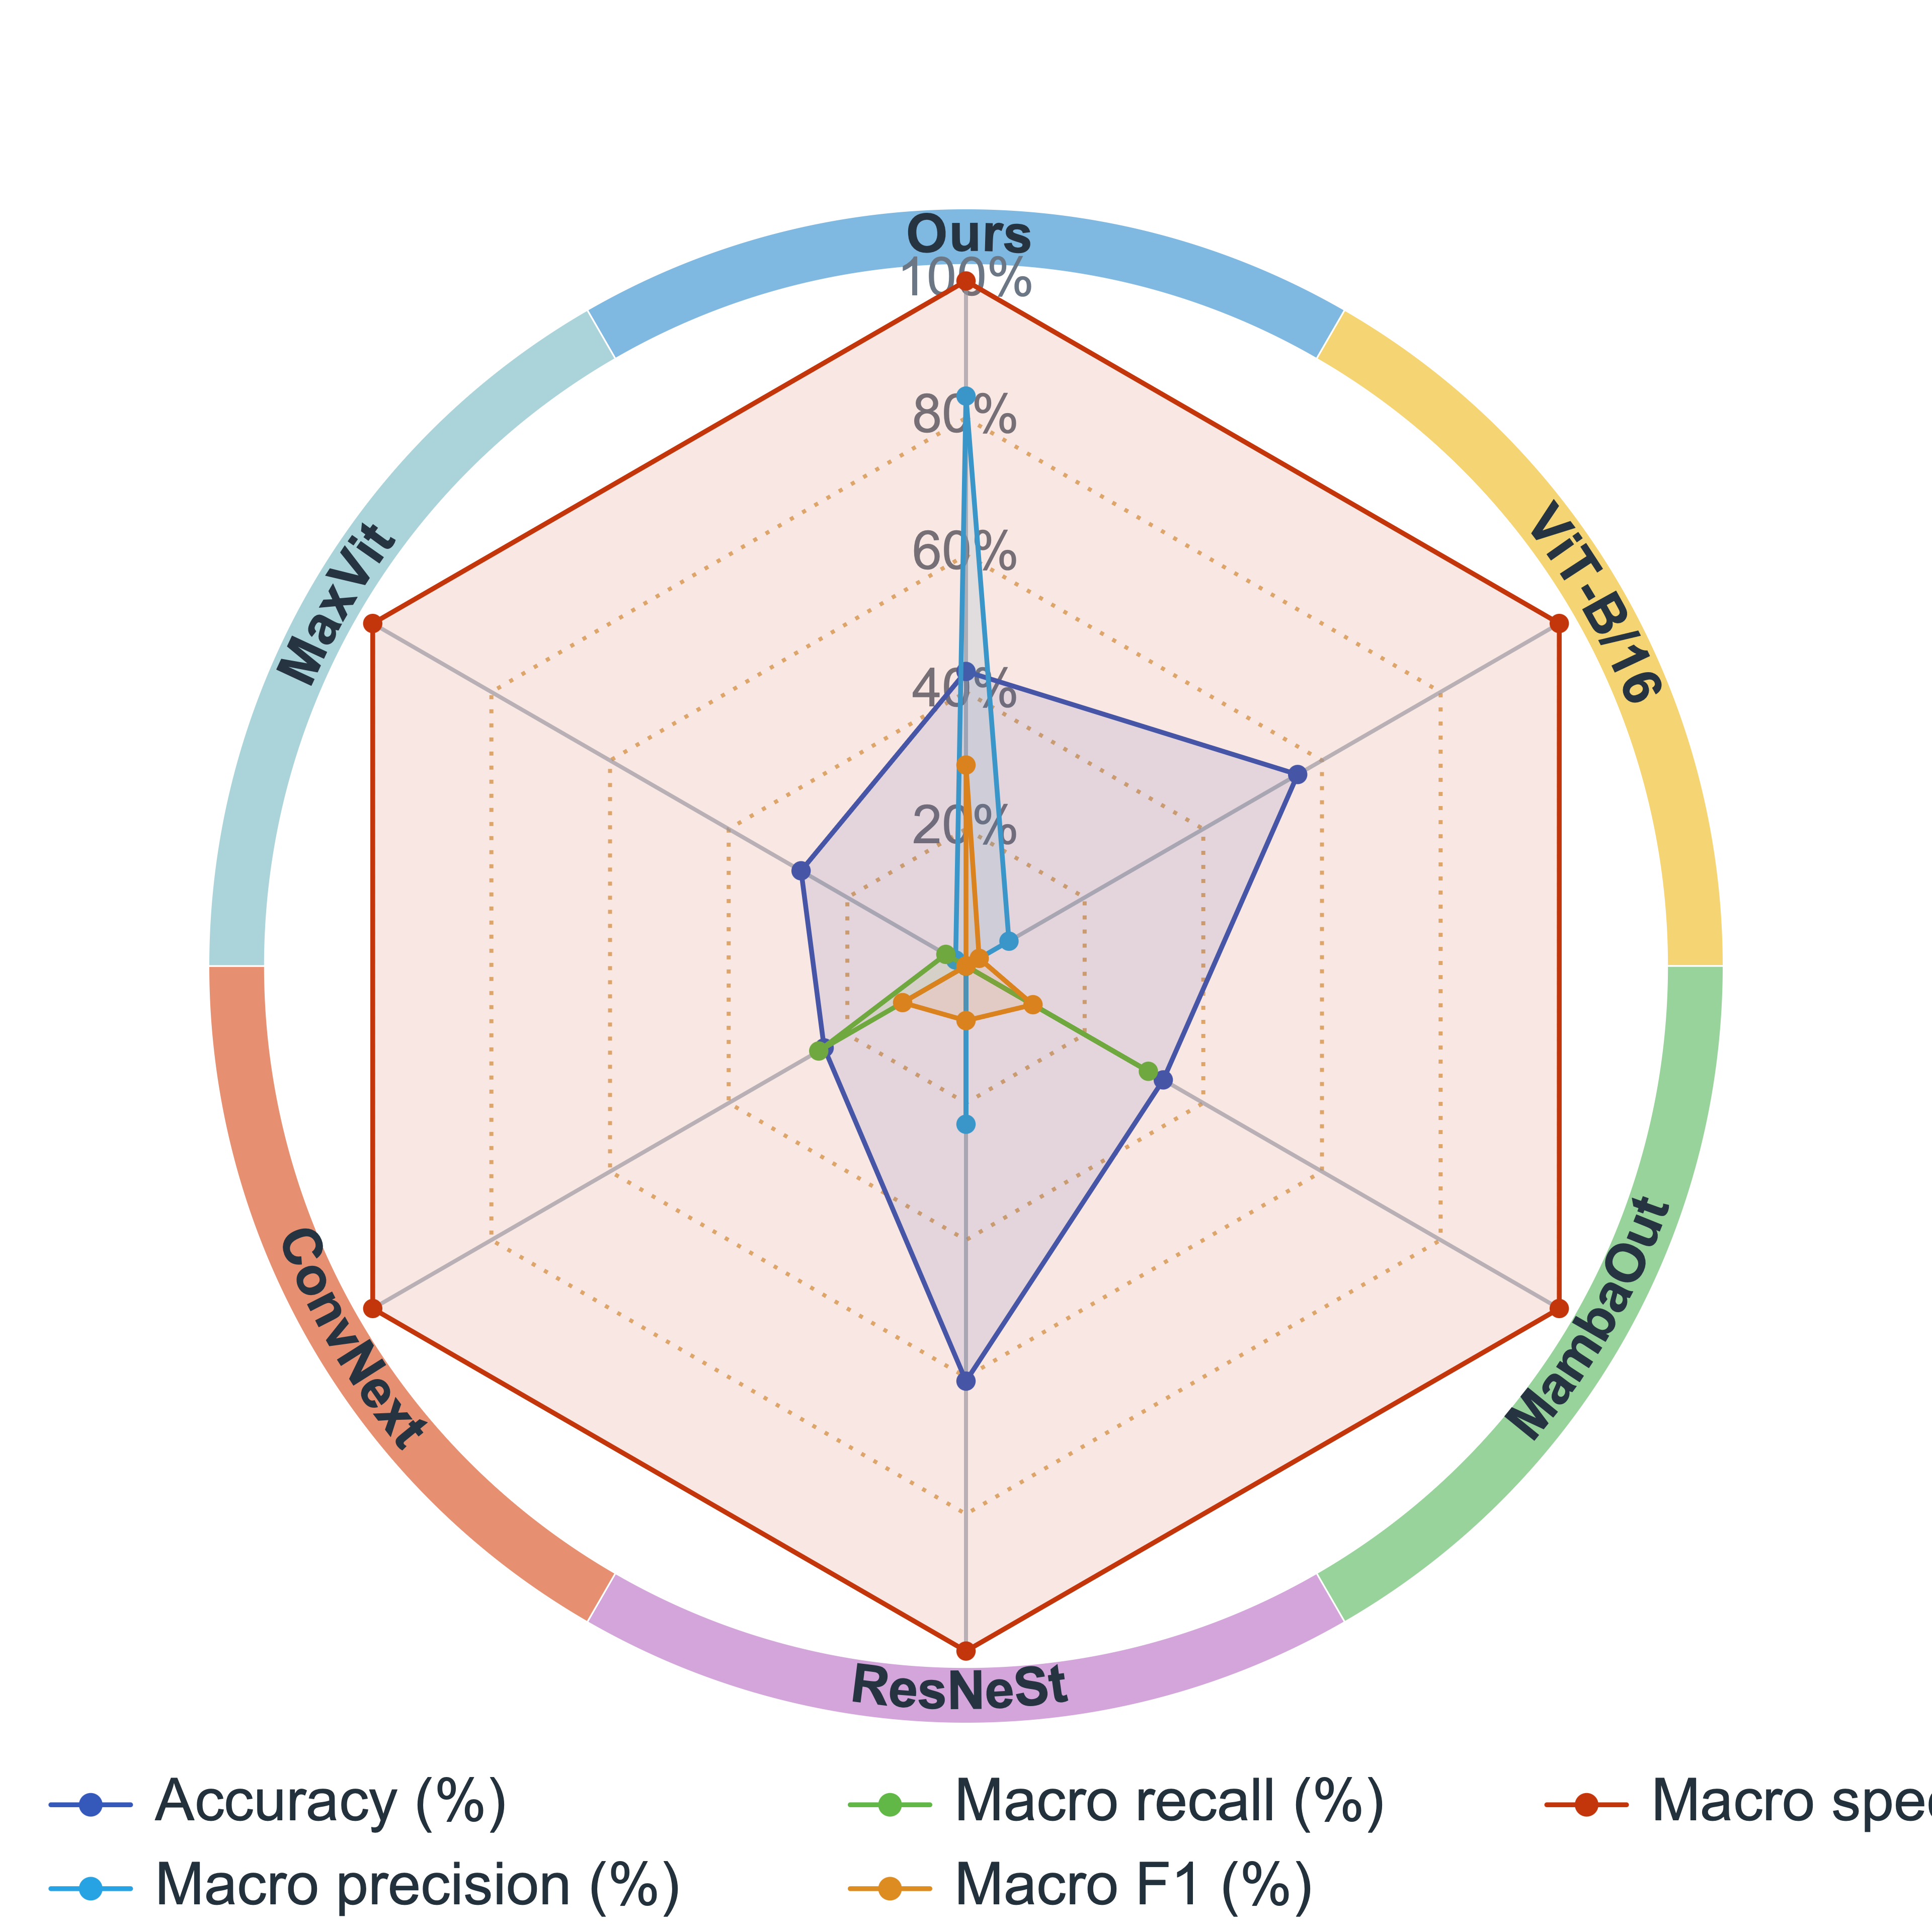
SmartPlot 1.55 adds standalone radar charts and continues tightening the data, axis, annotation, and Plus styling workflow for publication figures.
Radar charts headline V1.55
Create standalone radar charts for multi-metric comparison, then refine axes, grids, outer rings, labels, legends, and dataset styling from one workflow.
- Map row objects, column objects, or long-table data without rebuilding the table.
- Use colorful outer rings, curved labels, palettes, grids, and legends for paper-ready comparison figures.


Visual markers make figure elements easier to recognize
V1.55 makes figure-element entry points more visual: toolbar icons, Add-menu symbols, and new symbol markers help users recognize objects faster than reading text alone.
- The Add menu uses recognizable patterns for lines, annotations, arrows, highlight regions, shapes, and legends.
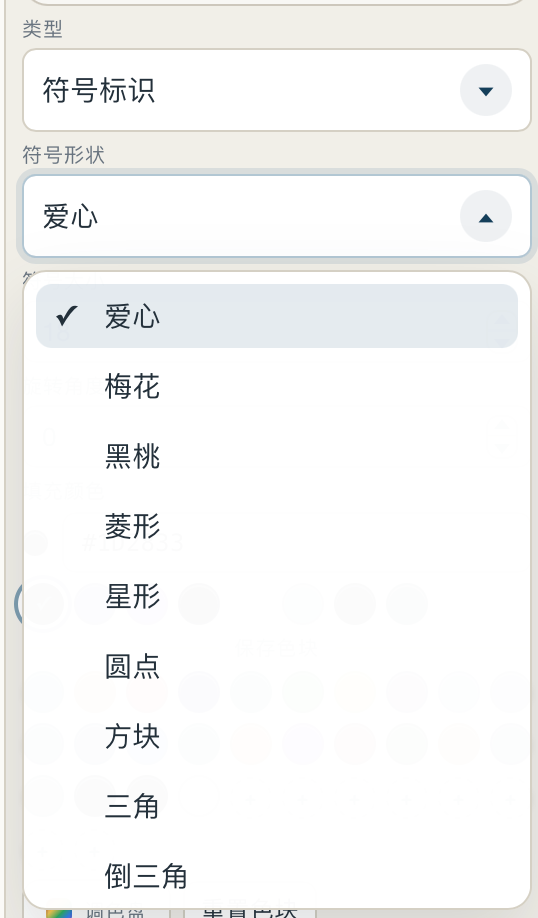
- New symbol markers provide multiple shapes, including hearts, flowers, spades, stars, dots, squares, triangles, and inverted triangles.
- Icons and patterns reduce text scanning and make dense figure editing easier to navigate.
New Select mode supports marquee selection and batch editing
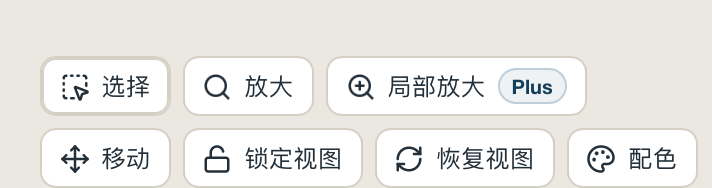
V1.55 adds a dedicated Select button so users can drag a selection box on the canvas, capture multiple objects at once, and then copy, paste, move, or process them together.
- Drag on the page to create a selection frame and collect multiple labels, shapes, markers, or other figure objects in one action.
- Selected objects can be copied, pasted, moved, deleted, or adjusted together instead of being handled one by one.
- The view toolbar keeps Select next to zoom, move, view lock, reset view, and palette tools, so editing and inspection stay in the same workflow.
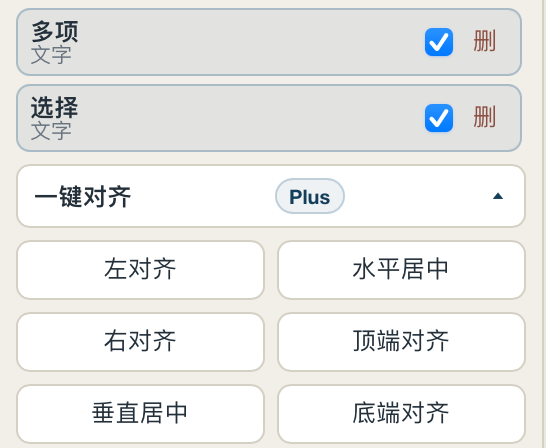
Plus: one-click alignment for annotation objects
After selecting multiple annotation objects, Plus users can align them from the inspector with one click instead of manually nudging each label into place.
- Supports left align, horizontal center, right align, top align, vertical center, and bottom align.
- Works well with the new selection workflow: select several annotations first, then apply an alignment command directly.
- Designed for text labels, symbol labels, and other callouts that need clean placement before export.
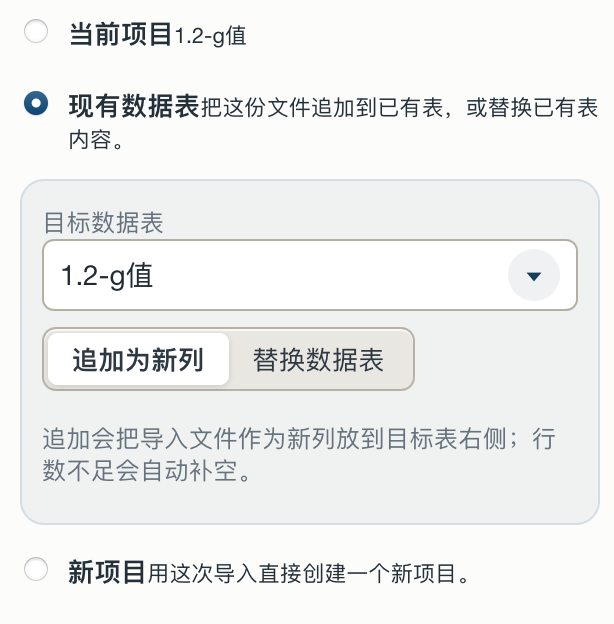
Data import can append into an existing table or replace it
V1.55 expands import behavior so a file can be added to an existing data table as new columns, or replace the current table content when that is the intended workflow.
- Appending places imported data to the right of the target table and fills missing rows automatically.
- Replacing the table remains available for workflows that need a clean reload.
- This works alongside LabVIEW LVM import support, unit rows, and unit conversion display.
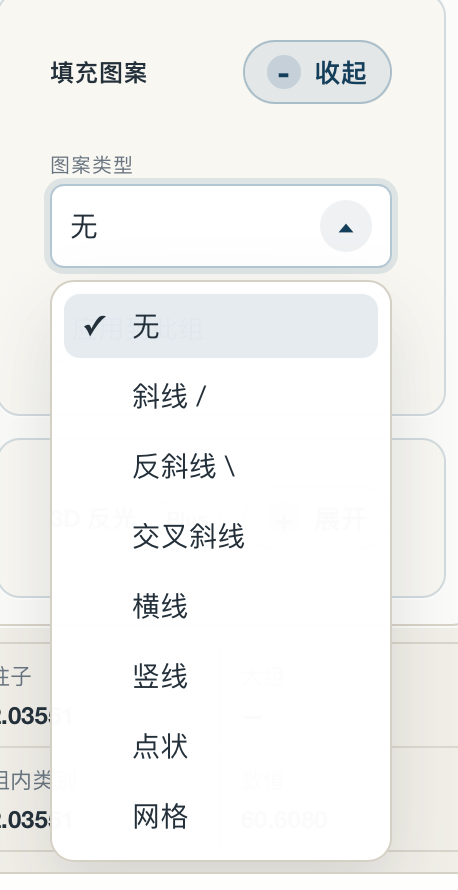
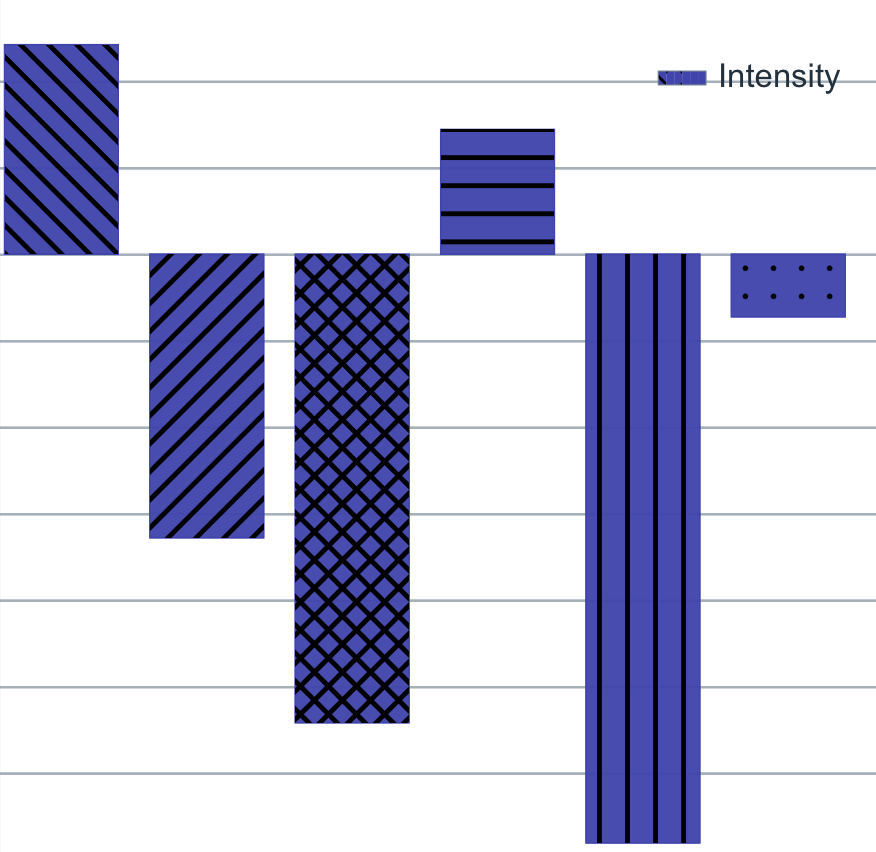
New fill patterns for bar charts and filled objects
Bar fills and filled regions now support independent pattern styles, making monochrome, print-friendly, and multi-group figures easier to distinguish.
- Pattern options include diagonal, reverse diagonal, cross diagonal, horizontal, vertical, dotted, and grid fills.
- Pattern type, thickness, spacing, opacity, and fill color are separated for better style control.
- The same visual language helps bar charts stay readable when color alone is not enough.
Also included in V1.55
Standalone radar charts are now available, including row/column objects, long-table mapping, radial axes, grids, labels, legends, and dataset styling.
Data tables can show unit rows and unit-conversion display, and copied data keeps unit information for export workflows.
Date/time axis properties recognize date-time values, Excel serial dates, and elapsed-time displays.
Line and scatter plots support text-based X axes without writing text into data-line labels.
Axis tick mapping supports LaTeX, scale factors, offsets, categorical axes, and automatic rotation display logic.
Symbol markers, selection mode, marquee selection, multi-object copy/paste, unified highlighting, and clearer resource-area icons improve editing speed.
Bar charts now support independent fill patterns with type, thickness, spacing, opacity, and color separation.
V1.55 also fixes custom ticks, data-line inspector switching, Windows double-click titles, narrow-screen title wrapping, SVG/PPT compatibility, and other V1.5 feedback.
Past News
SmartPlot V1.5
June 9, 2026Axis frame control, inset zoom, significance analysis, and chart interaction fixes.
Issue 1.4SmartPlot V1.4
June 3, 2026Focus on settings, reusable styles, shortcuts, analysis presentation, and data cleanup.
Issue 1.1.4SmartPlot V1.1.4
May 2025Earlier foundation release for scientific plotting, base analysis, and export workflow.