WHAT’S NEW?
SmartPlot V1.5 release
SmartPlot 1.5.0 focuses on publication-ready control over plot structure: stronger axis styling, inset zoom, richer axis and legend controls, bar-chart significance analysis, and safer edit-flow fixes.
Precision axis and scale control
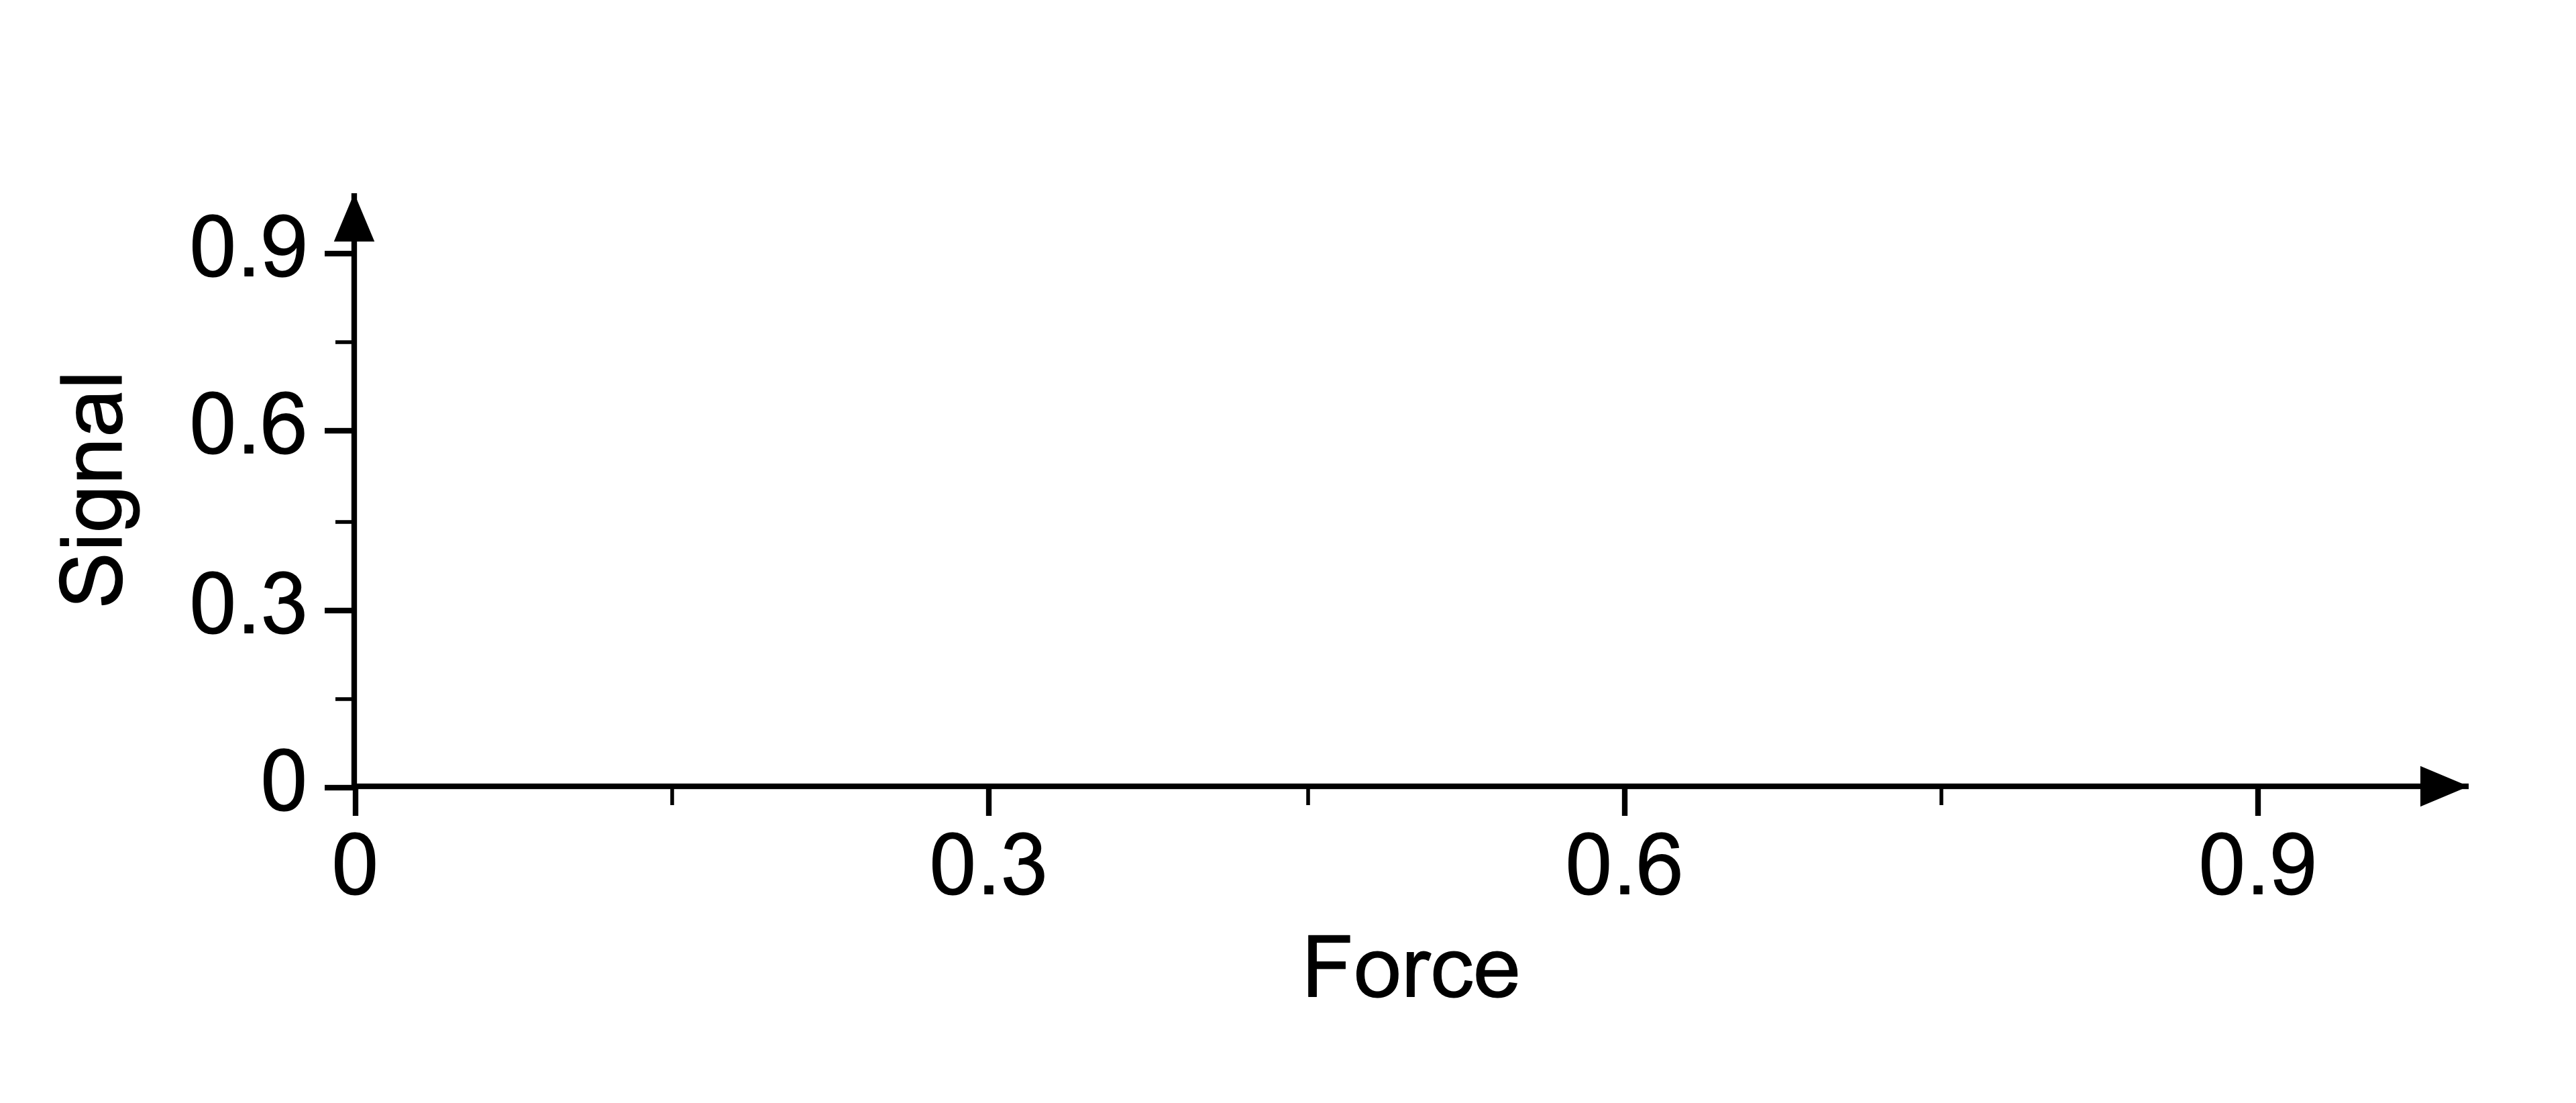
Axes now support cleaner frame logic: keep only X and left Y for a cleaner print layout, hide right/top lines, add axis arrows, and use split/broken axis sections when needed.
- Show only X and left Y axes, hide upper/right axis lines independently.
- Axis breaks can now split discontinuous ranges for large gaps in data.
- Arrowed axis ends and additional line style options are now available.

Inset zoom that stays inside the main plot
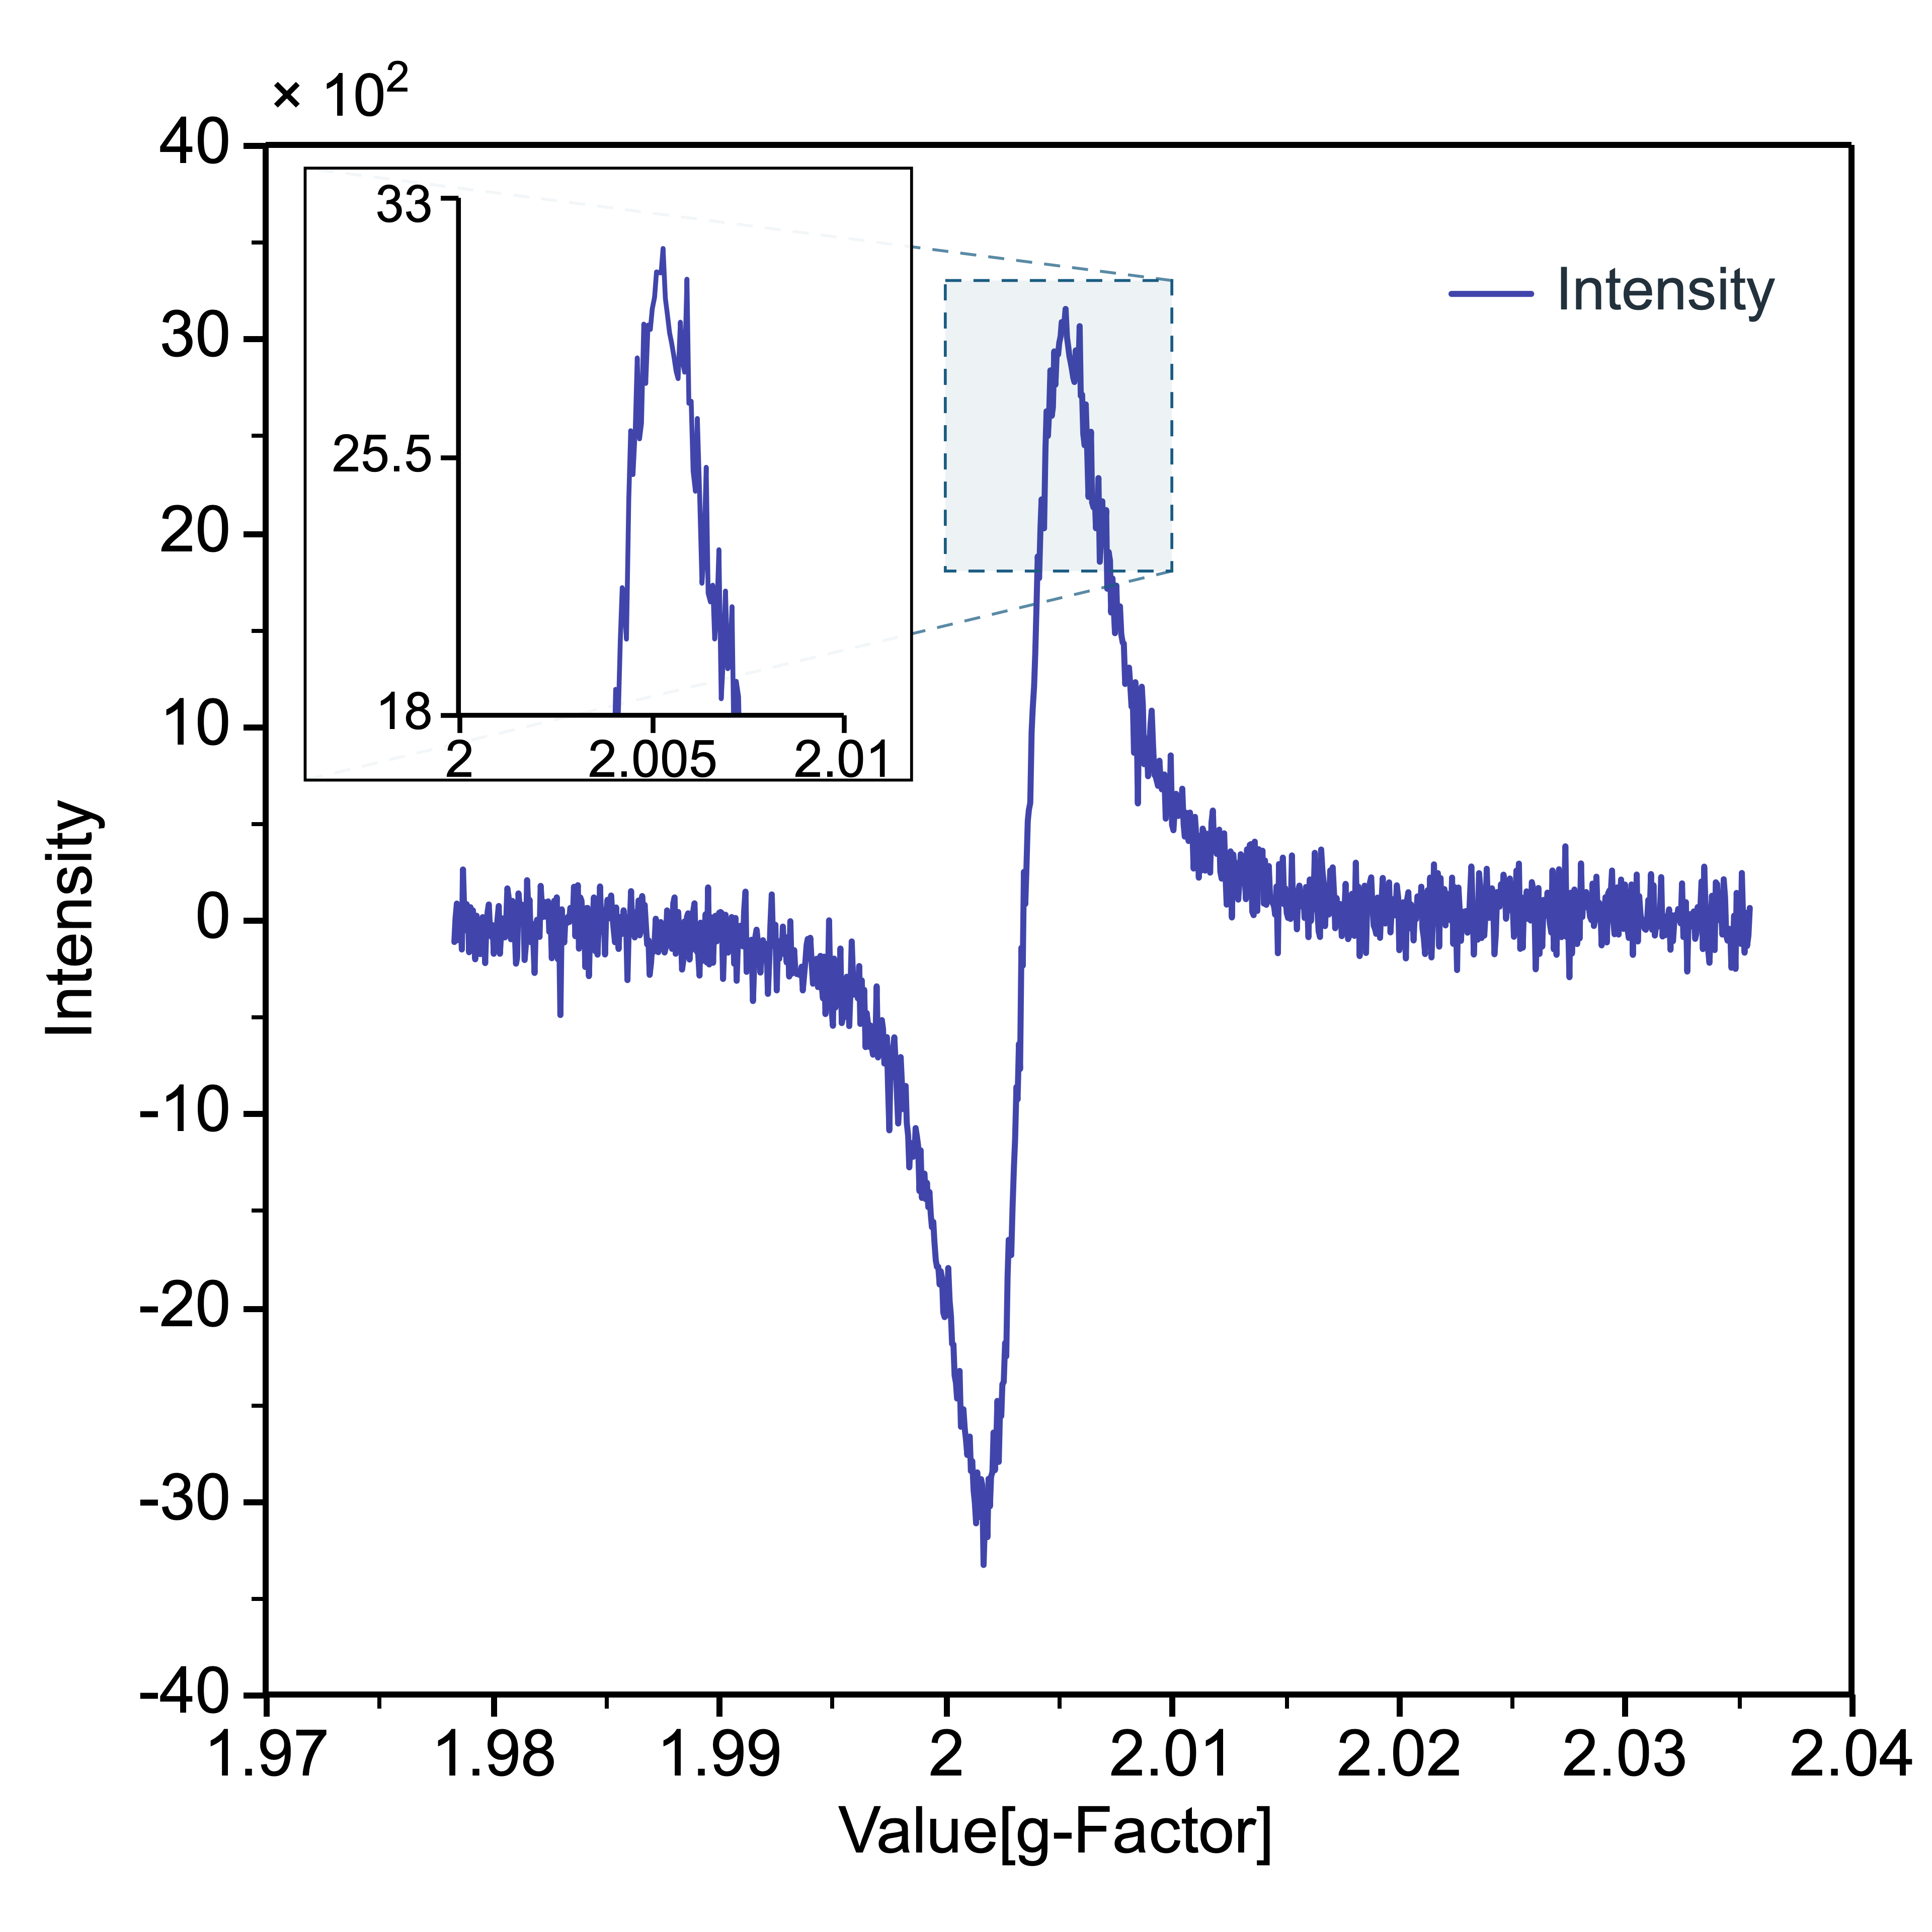
Add an editable zoom inset inside the same figure instead of building extra 1x2 or 2x1 subplots.
- Inset zoom objects can be copied, moved, scaled, and styled as part of the main plot.
- Connector style and inset placement are independent so the zoom area and main view stay visually aligned.
- Inset coordinates remain editable for line and scatter workflows.
Expanded tick and label controls
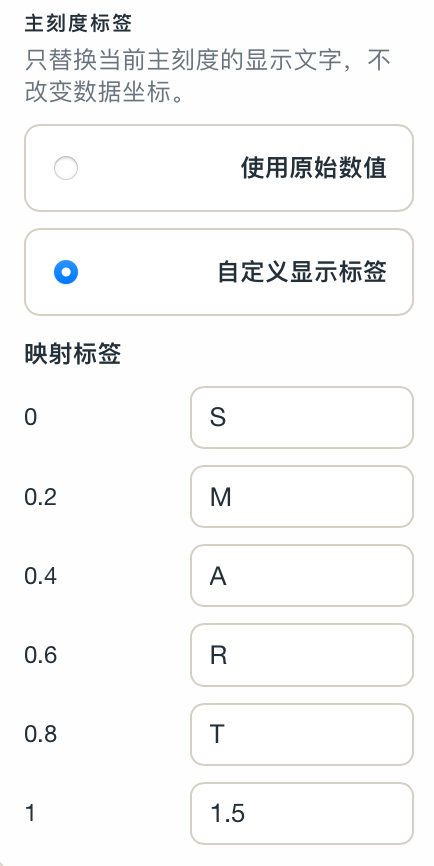
Tick labels now have independent control for text values and color, including custom text on X for line and scatter charts.
- Custom tick labels can replace numeric labels where needed.
- Tick number color is now independently configurable from the axis style.
- For line and scatter charts, X custom text can be moved outside the axis frame.

Legend and error bar priority refinements
Legend and error-bar rendering order can be tuned for dense figures to reduce overlaps and keep key channels readable.
- Legends now support multi-row layouts (for example two rows) rather than forced single-track packing.
- Error bar layer depth is now user controllable for dense line/point overlays.
- Scatter and line styling can prioritize labels and marks while preserving analytical readability.

Data-editing and conversion workflow fixes
Pasting data and changing chart type now keep the workspace state more stable.
- When pasting multiple rows into an empty table, SmartPlot prompts whether the first row is a header.
- Bar-to-line conversion no longer leaves stale bars; converted charts now refresh correctly.
- Axis, tick, and legend settings now survive repeated conversion and refresh steps.
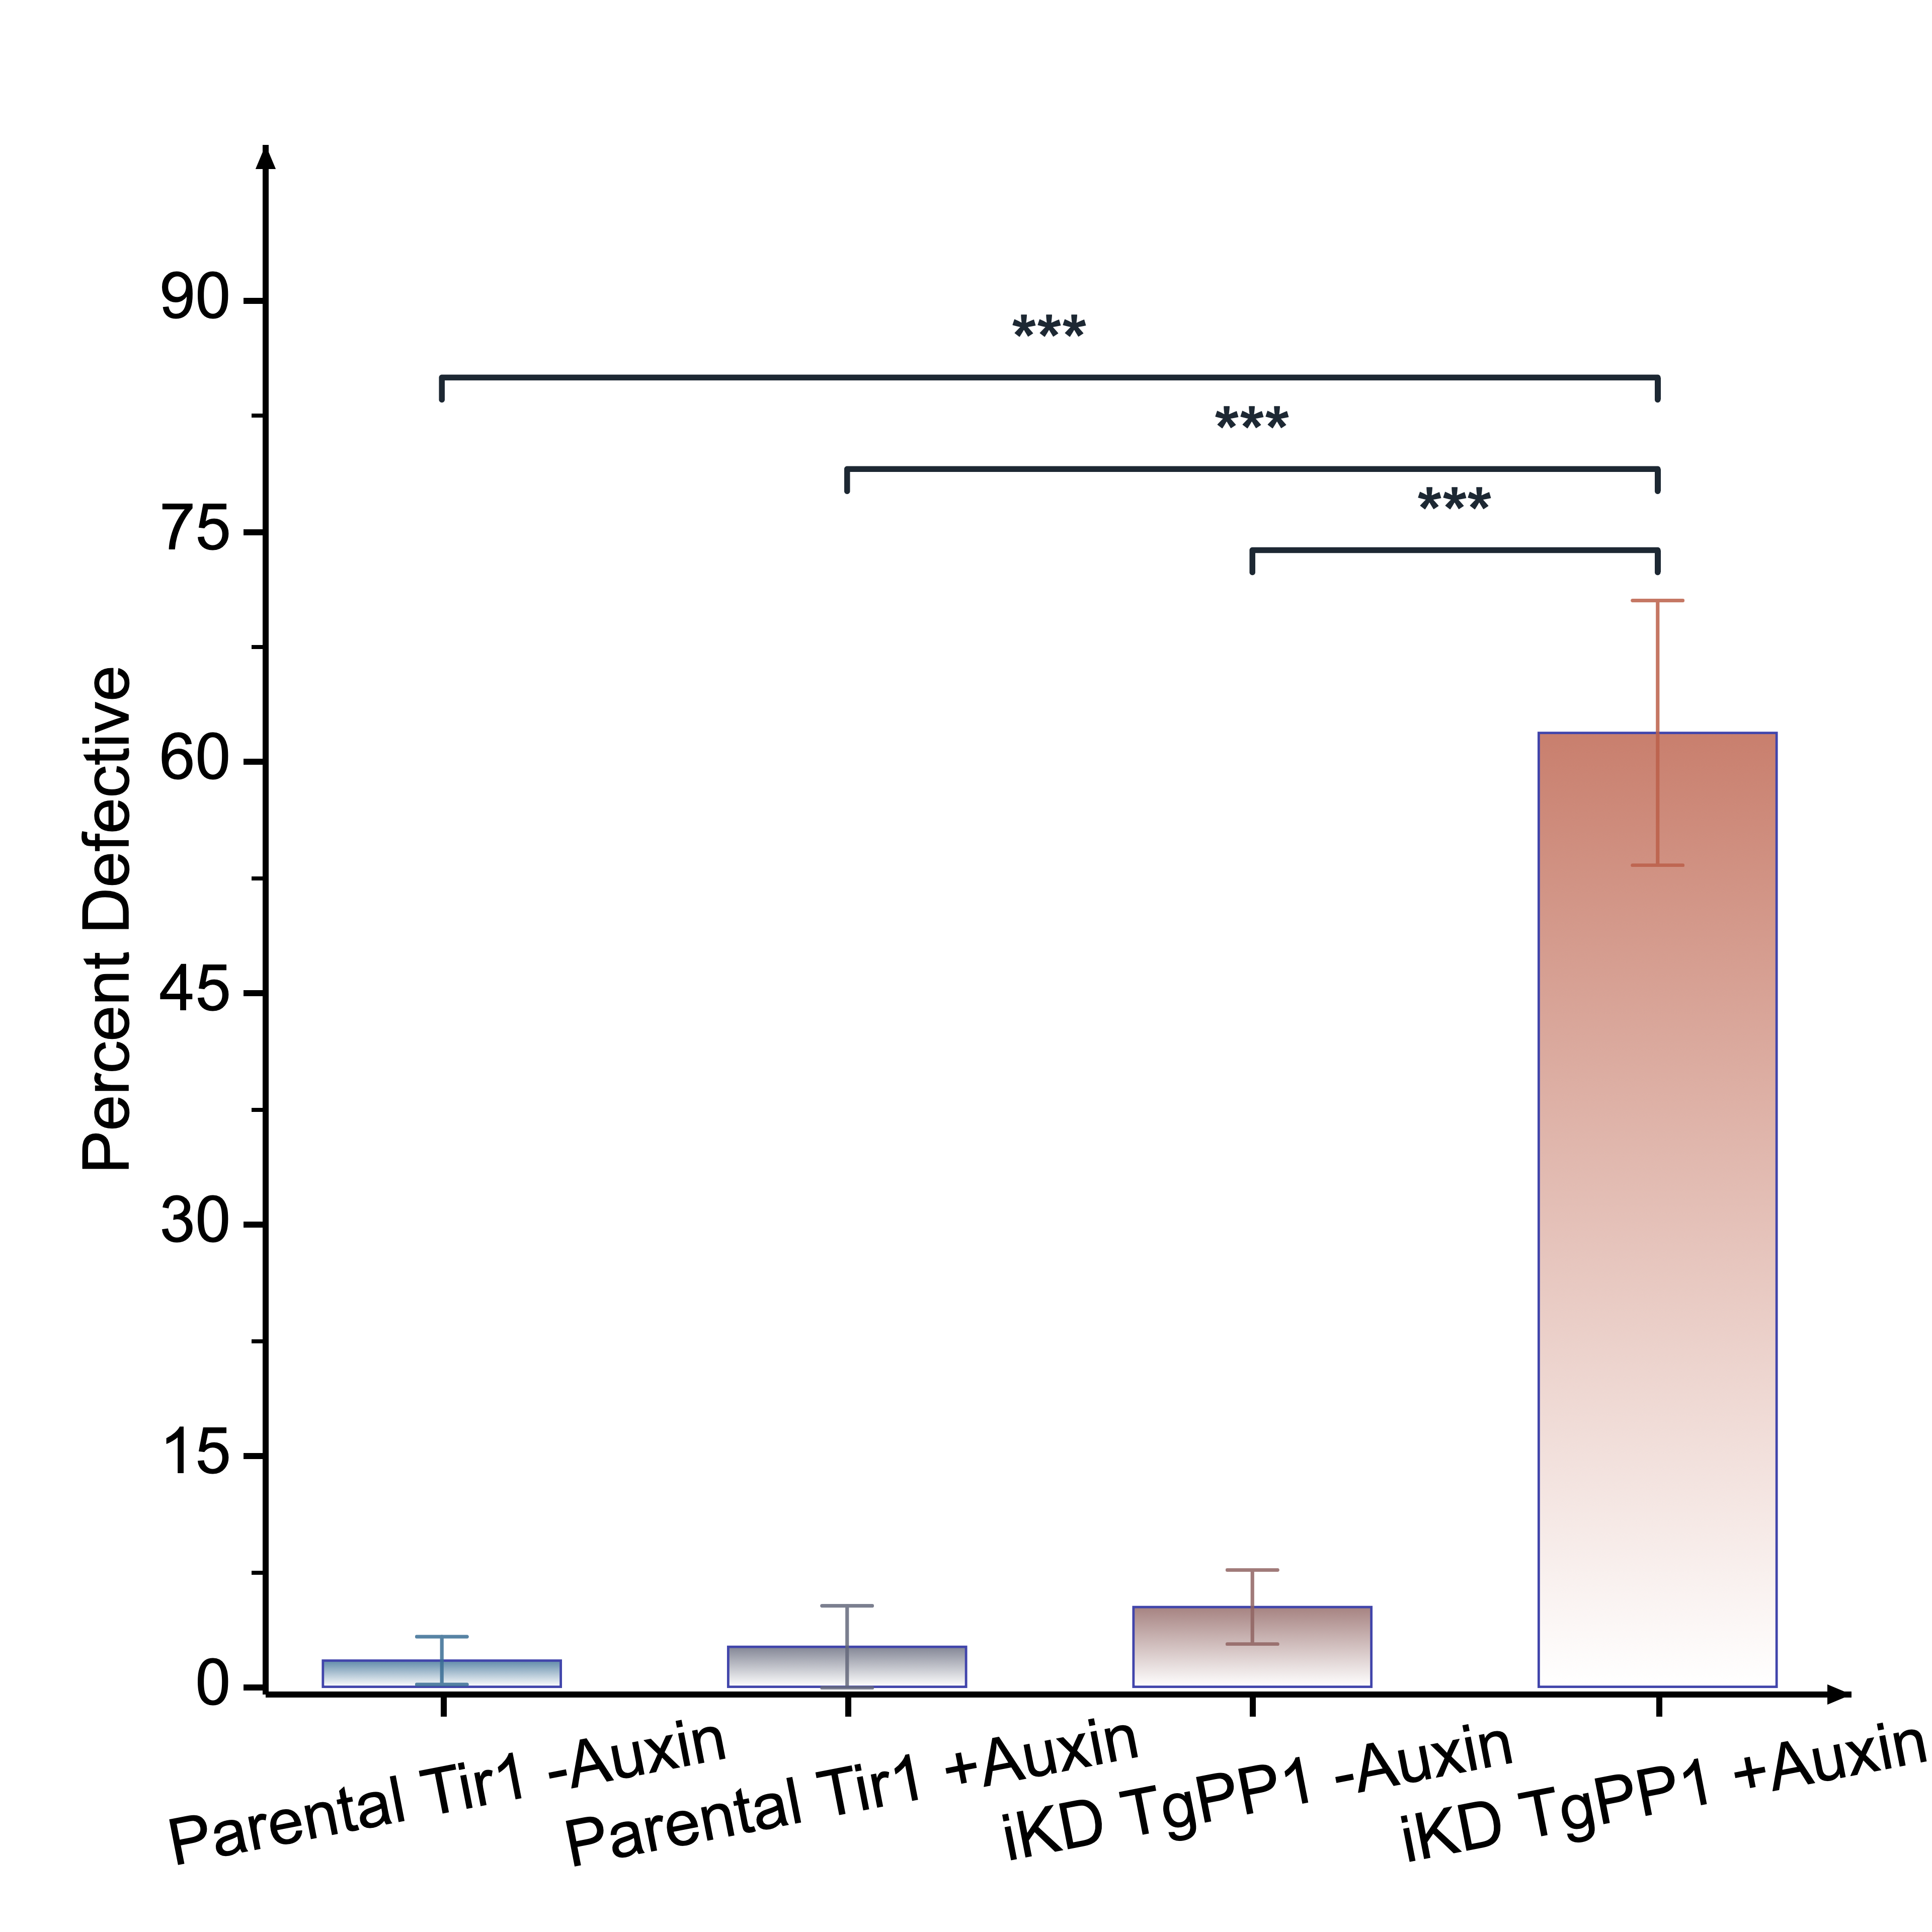
New: Significance analysis for bar charts
After creating a grouped bar chart, run Significance Analysis from the statistics analysis tools to add comparison results without rebuilding the figure.
- Start from a finished bar chart based on statistical categories, then choose the significance workflow under analysis statistics.
- Supports t-test, Welch-style comparisons, one-way ANOVA, and common pairwise comparison modes.
- Outputs reusable brackets, stars, labels, and a derived result table for figure review and export.
Also included in V1.5
Axis frame model now supports custom frame hiding, axis arrows, and break sections in one workflow.
Inset zoom is now a native chart object, including ROI and connector control, and it is editable in workspace object tools.
Tick labels now support text mode and independent color control, with custom X labels that can be moved outside axis bounds.
Legend layout supports multi-row organization for dense plot annotation.
Error bar rendering supports explicit layer ordering for clearer overlays.
Bar-to-line conversion correctly removes old bars after converting.
Pasting into an empty table now asks whether the first row is header or data.
Data import and conversion fixes are included as workflow polish rather than a separate headline panel.